2020-05-08
This trade idea came from Investor’s Business Daily where is was featured in their IBD 50 over the past few weeks. It was #36 in IBD Weekly Vol 37 No 2, #34 in IBD Weekly Vol 37 No 2, and #29 in IBD Weekly Vol 37 No 2
My weekly review of charts SIMO caught my attention. It was in a tightening range and looking for it to break out. I decided to purchase Call options, because I wanted to limit the amount I could lose
I bought this after lunch: SIMO Jun 19 2020 45 Call @1.55. The stock price around $43.50 at the time. This a stock substitution type of a play, because the earnings announcement is after expiration
IBD Rankings 05/08/20
Composite Rating: 90
EPS Rating: 86
RS Rating: 84
Group RS Rating: C+
SMR Rating: A
Acc/Dis Rating: C+
ROE: 17.2%
Debt: 0%
Outstanding Shares: 35.1m
Float: 32.0m
EPS Due Date: 07/30/20
From TD Ameritrade Quote Summary 05/08/20
P/E Ratio: 18.73
Ex-dividend date: 05/06/20
Zack’s has this as 2 – Buy: SIMO
Dr Alexander has a triple screen for viewing charts and Trading for a Living is why I use the following charts
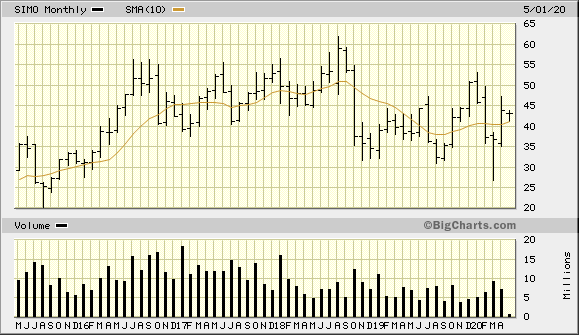
This is above 10 Month SMA, but has been basically flat for 5 years
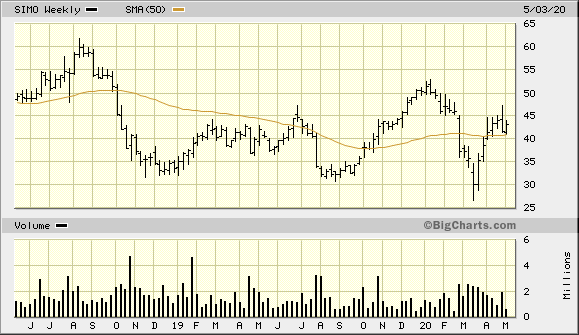
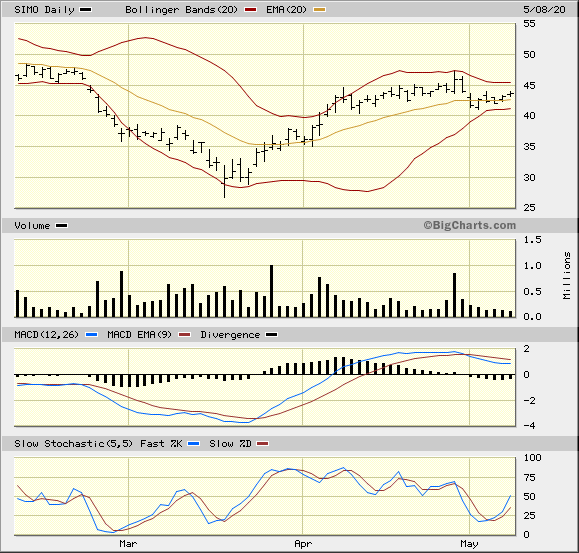
The Bollinger Band is squeezing tight and I’m thinking that it is going to break higher
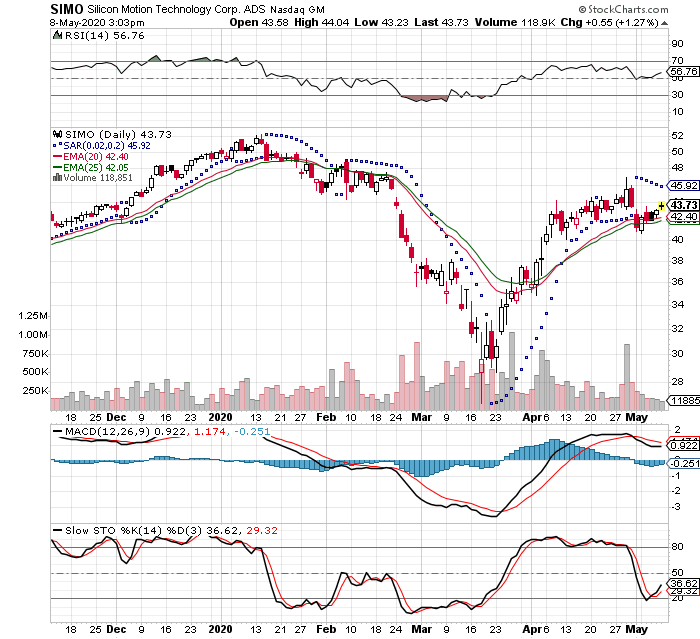
If the stock drops to $40 a share I will sell to close to preserve capital. On the upside I will be selling at $60. The break even for the trade is at &46.56. I do not want to own the stock and will close this out before expiration
2020-06-16
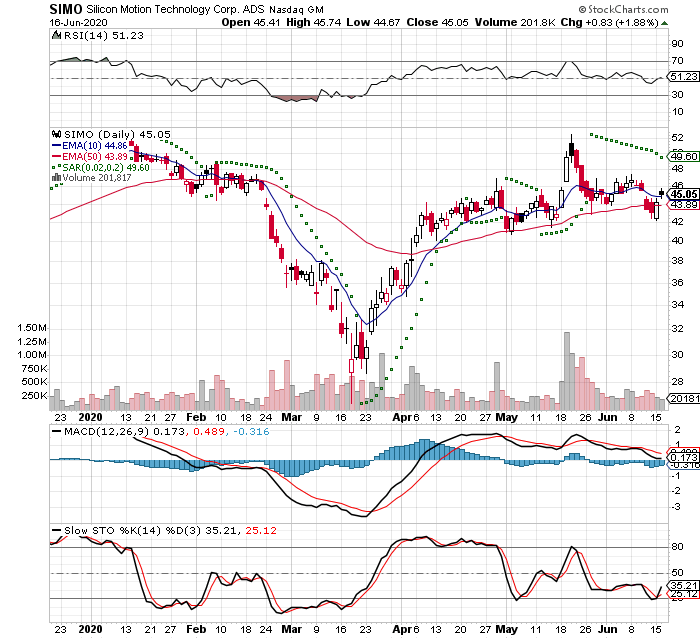
I closed out my position this afternoon, because it is close to expiration and I do not want to own the stock. I believe that the stock is not going to reach the $50/sh before earnings
The stock has been consolitating and I don’t have time left on the contract. This company will be on my watch list and may purchase again to capture earnings. I got filled at .95. That was a -67% loss and limited my loss at -$123.66. Lesson learned.
I had thought about selling after the pop, but waited. I was greedy and I should have closed out half the position then. I would have been playing with the house’s money
This is Stockcharts 3 month chart
