Technical analysis is using historical price charts to predict the future. Price and volume are the main drivers, but by analyzing the rates of these changes over time give clues to a bias either up or down. Accumulation/Distribution have certain patterns that signal additional research when looking for an opportunity to trade.
When considering a new opportunity I like to use a triple screen approach. By that I'm meaning that using 3 different time frames to put into context the current consensus of value. There are 3 different actors in any market: Investors, Position or Swing Traders, and Professional Traders and the kernel of this idea came from Dr Alexander in Trading for a Living.
Investors take a long term view point. This category is the majority of the market and the goals and objectives of this class are for an overall gain over a number of years. These are big shifts in the money flows for the company.
Position Traders enter a trade for 2 weeks to 1.5 years. These are mostly retail investors that risk capital and are looking to purchase an asset in order to sell for a quick gain
Professional Traders. This category has anyone that have an asset size, has a fiduciary responsibility, or classed as such.
To track Investors I look at a 5 year chart first and I toss in a 200 SMA (Simple Moving Average). The 200 day is approximately 1 year and there have been several studies about using this as a broad Buy/Sell signal. If a stock crosses above this average then it is a Buy and if it crosses below it's a Sell. EMAs are lagging indicators - they only move after the fact All moving average indicators are just for trend identification.
What is the slope? Moving averages determine trend and the slope gives an expected rate of return when projected out.
Another function of moving averages are for support and resistance levels. The prices tend to bounce off of these levels. If the price is above then often when a stock touches this line thane it will bounce back above. If the price is below then if it rises to that line the price action hits a wall and trend back down.
This is an example of Apple (AAPL) 5 yr Daily chart from bigcharts.com
Next is a 1 year daily chart. I like to use a 50, 100, 150 EMA and by using these I'm looking for cross over points that signal a change in direction.
Current 1yr Daily
Then a 6 month daily and there numerous indicators to use and you can be confused by using too many. I use a 20 day EMA, because I'm looking for options and a 20 day is about 1 month.
Bollinger bands. This is to spot trading greater than 2 standard deviations outside the normal trading range. I use this to track overbought/oversold, because if the stock breaks this band then it's a significant event. The stock can continue in this direction for some time, but it also gauges the volatility by expanding or contracting based on the trading ranges. Periods of contraction shrink the bands, Periods of increased volatility expand the bands. With a contracting range it indicates that a big move either way is coming.
MACD (Moving Average Convergence Divergence) tracks to different moving averages and the differences are the histogram. What I'm looking for when using this is general trend confirmation. If it's positive, above 0 then the overall trend is positive. The crossovers are important only if confirmed with other indicators. This doesn't work well in flat markets.
Slow Stochastic tracks the rate of change and above 80 is overbought and below 20 is oversold. This is an oscillator and tracks the velocity of the trades. This is useful to pick up a great company that's having a bad couple of days in the market.
There are no foolproof indicators and just because an indicator is overbought/oversold it can continue in that direction.
Current 6 Month Daily

I am working on a Candlestick page and Steve Nison wrote the classic textbook on the subject. This is a different way of viewing the same Open High Low Close style of charts. There are several defined patterns the predict trends
I came across this in StockCharts.com Chart School researching Parabolic SAR. This will be on my reading list and updates will come shortly.
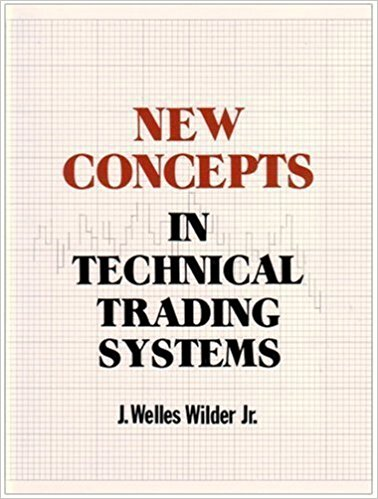
Wilder introduced the Parabolic Time/Price System in his 1978 book, New Concepts in Technical Trading Systems. This book also includes RSI, Average True Range (ATR), and the Directional Movement Concept (ADX). Despite being developed before the computer age, Wilder's indicators have stood the test of time and remain extremely popular.
