This trade idea came to me when I was reviewing my watch list. It was featured in Investors Business Daily: New America Vol 37 No 3 Week of April 28, 2020. I liked the chart and waited for a pull back to enter the position
I went with Call options to limit my losses. The Jun 19, 2020 Call option has 38 days to expiration and is lottery ticket. They are heavly leveraged and have a high P/E Ratio
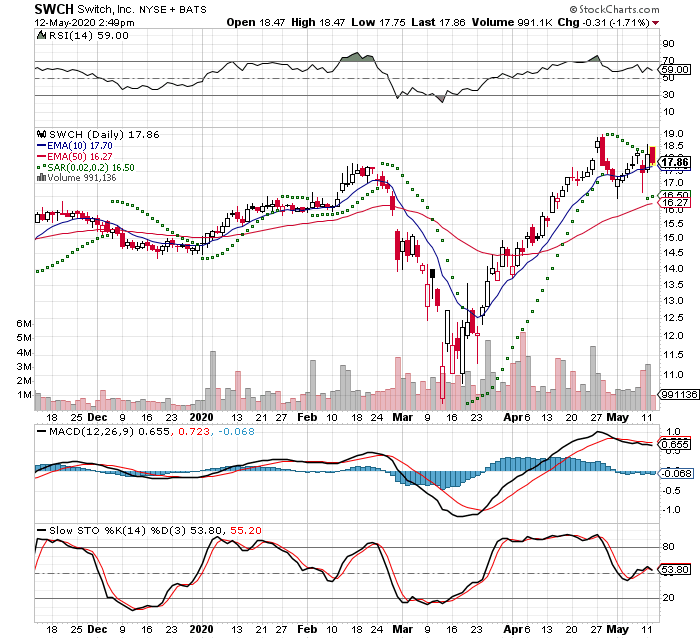
I got filled this morning: Buy to Open 2 SWCH Jun 19 2020 19.0 Call Limit 0.55
IBD Rankings 05/12/20 Composite Rating: 85 EPS Rating: 10 RS Rating: 94 Group RS Rating: A SMR Rating: C Acc/Dis Rating: A- ROE: 5.1% Debt: 387% – Heavly Leveraged Outstanding Shares: 103.0m Float: 75.2m EPS Due Date: 08/07/20
From TD Ameritrade Quote Summary 05/12/20 P/E Ratio: 223.25x – Price is way out of line with actual earnings Ex-dividend date: 05/21/20
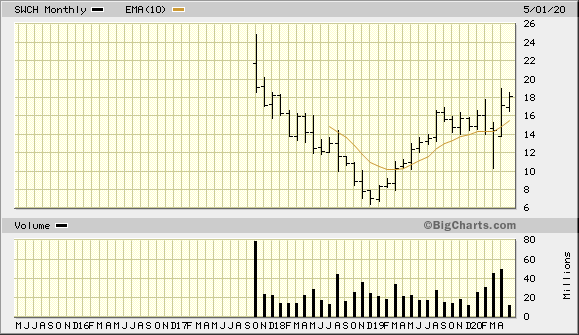
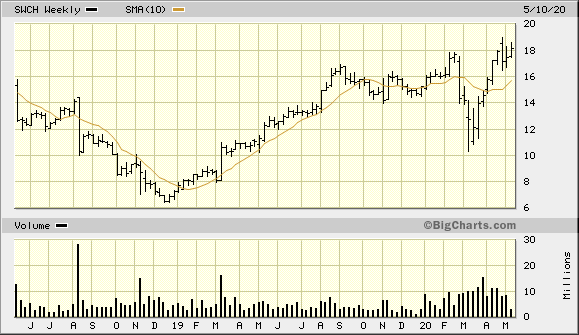
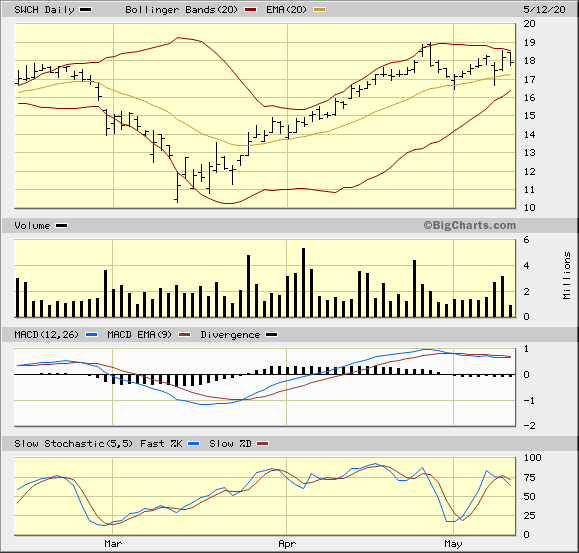
Dr Alexander has a triple screen for viewing charts and Trading for a Living is why I use the following charts
SWCH 5 Year Monthly from BigCharts 2020-05-12SWCH 2 Year Weekly from BigCharts 2020-05-12SWCH 3 Month Daily from BigCharts 2020-05-12SWCH 3 Month Daily from StockCharts 2020-05-12
This trade idea came from Investor’s Business Daily where is was featured in their IBD 50 over the past few weeks. It was #36 in IBD Weekly Vol 37 No 2, #34 in IBD Weekly Vol 37 No 2, and #29 in IBD Weekly Vol 37 No 2
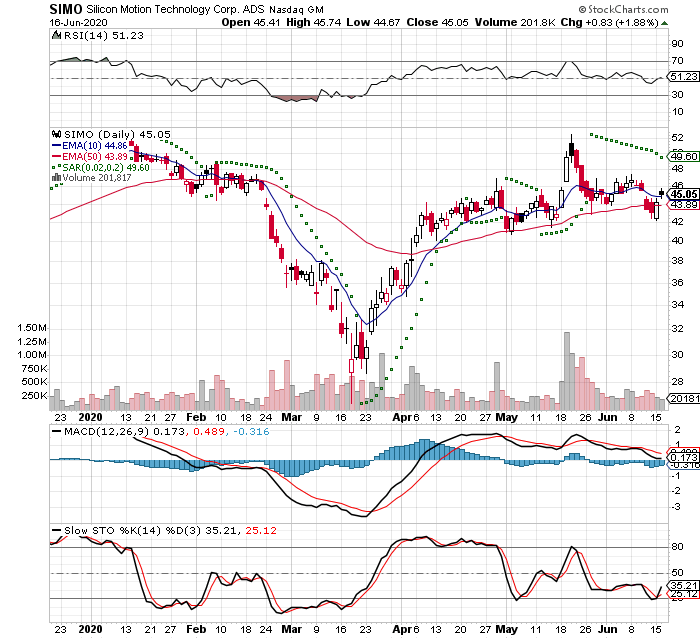
My weekly review of charts SIMO caught my attention. It was in a tightening range and looking for it to break out. I decided to purchase Call options, because I wanted to limit the amount I could lose
I bought this after lunch: SIMO Jun 19 2020 45 Call @1.55. The stock price around $43.50 at the time. This a stock substitution type of a play, because the earnings announcement is after expiration
Dr Alexander has a triple screen for viewing charts and Trading for a Living is why I use the following charts
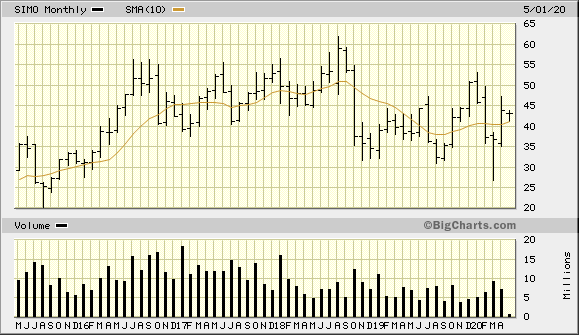
SIMO 5 Year Monthly from BigCharts 2020-05-08
This is above 10 Month SMA, but has been basically flat for 5 years
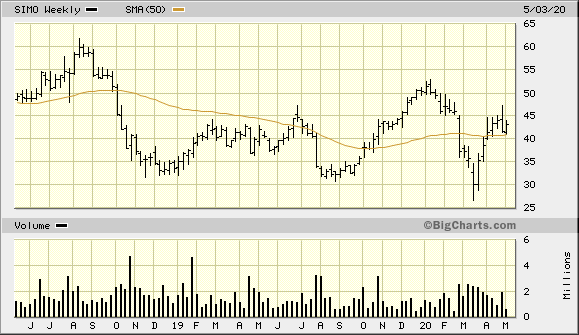
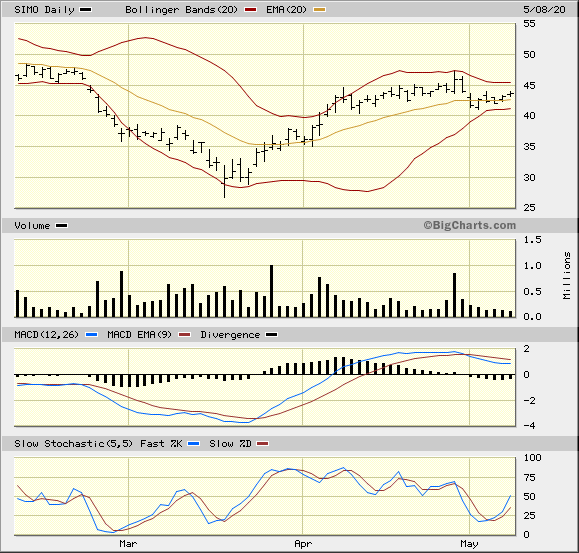
SIMO 2 Year Weekly from BigCharts 2020-05-08SIMO 3 Month Daily from BigCharts 2020-05-08
The Bollinger Band is squeezing tight and I’m thinking that it is going to break higher
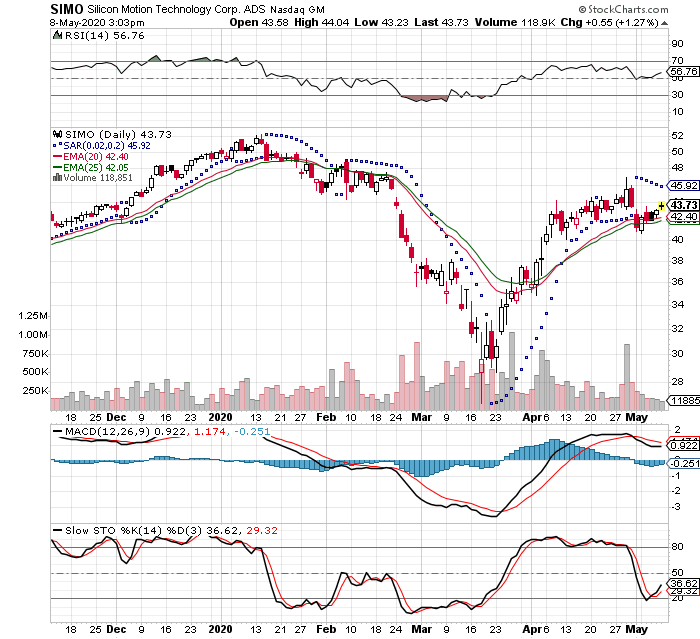
SIMO 3 Month Daily from StockCharts 2020-05-08
If the stock drops to $40 a share I will sell to close to preserve capital. On the upside I will be selling at $60. The break even for the trade is at &46.56. I do not want to own the stock and will close this out before expiration
2020-06-16
I closed out my position this afternoon, because it is close to expiration and I do not want to own the stock. I believe that the stock is not going to reach the $50/sh before earnings
The stock has been consolitating and I don’t have time left on the contract. This company will be on my watch list and may purchase again to capture earnings. I got filled at .95. That was a -67% loss and limited my loss at -$123.66. Lesson learned.
I had thought about selling after the pop, but waited. I was greedy and I should have closed out half the position then. I would have been playing with the house’s money
The United States Natural Gas Fund® LP (UNG) is an exchange-traded security that is designed to track in percentage terms the movements of natural gas prices. UNG issues shares that may be purchased and sold on the NYSE Arca.
The investment objective of UNG is for the daily changes in percentage terms of its shares' net NAV to reflect the daily changes in percentage terms of the price of natural gas delivered at the Henry Hub, Louisiana, as measured by the daily changes in the Benchmark Futures Contract, less UNG's expenses.
The Benchmark is the futures contract on natural gas as traded on the NYMEX. If the near month contract is within two weeks of expiration, the Benchmark will be the next month contract to expire. The natural gas contract is natural gas delivered at the Henry Hub, Louisiana.
UNG invests primarily in listed natural gas futures contracts and other natural gas related futures contracts, and may invest in forwards and swap contracts. These investments will be collateralized by cash, cash equivalents, and US government obligations with remaining maturities of two years or less.
UNG's Fund Benefits
UNG offers commodity exposure without using a commodity futures account.
UNG provides features including, intra-day pricing, and market, limit, and stop orders.
UNG provides portfolio holdings, market price, NAV and TNA on its website each day.
2019-10-08
This trade idea came to me by the book
Set up Buy the Feer and Sell the Greed
Buy 4 Day RSI oversold below 20 - was at 4.95 on 09/30
Sell 4 Day RSI reaches 50
The is an ETF that tracks natural gas. Liquefied Natural Gas was a hot topic by a couple of the keynote speakers at the Chicago Trade Expo this year. I had held off on purchasing and saw the value drop almost 30% from the May.
Then I saw it pop and have a significant move. I missed the move up and put it back on a watch list. I was looking for a good entry point. It started to drop and I was looking for a rounding out on light volume
That didn't happen and the selling started getting stronger. Then it gaped down and I decided on using a call option to limit the downside. I went will a slightly out of the money call option at $20 and went 46 days out to give me some time
UNG Nov 15 2019 20.0 Call
2019-10-01 Buy to Open $20 Calls Exp 11/15/19 2 contracts Filled at $1.16
The current price $19.65
Target $21.29 at 50 day EMA
Dr Alexander has a triple screen for viewing charts and Trading for a Living is why I use the following charts
UNG 5 Year Monthly from BigCharts 2019-10-08
UNG 2 Year Weekly from BigCharts 2019-10-08
UNG 3 Month Daily from BigCharts 2019-10-08
UNG 3 Month Daily from StockCharts 2019-10-08
UNG 3 Month Daily from StockCharts 4 Day RSI 2019-10-08
2019-10-24
I closed out this position today, because I felt that it will not be a positive by the time the option expires. This position was positive for a day and basically covered the round trip costs. I think the biggest issue with the trade was the fact that it was below the long term average didn't allow it to lift off of the fear point
I will be adding a filter that a stock will need to be above a 200 day SMA
I got filled at $.63 and I'm glad I only had a Call option to limit my losses
$1.55 - $.63 = -.92 / 1.55 = -59%
UNG 3 Month Daily from StockCharts 4 Day RSI 2019-10-24
Enphase Energy, Inc. is a global energy technology company and the world’s leading supplier of solar microinverters. The Company delivers smart, easy-to-use solutions that connect solar generation, storage and management on one intelligent platform. Its semiconductor-based microinverter system converts energy at the individual solar module level and brings a system-based high-technology approach to solar energy generation, storage, control and management.
2019-09-22
This trade idea came from reviewing Investor's Business Daily Stock on The Move on Thursday 2019-09-19. I liked the chart and decided to buy off of that.
This was a buyable gap up and it closed the gap. In candlestick speak it closed the window and is finding support again.
It passed several of the criteria and I saw the MACD and MACDH were crossing and turning positive. There were several moving averages were also crossing
It opened lower in the first hour of trading. Based on the moving averages I didn't think it would go lower and bought. That turned out to be a great fill
This is a risky trade please do your own due diligence
I got filled at $26.28
Stop Loss -19% at $21..25
This is a larger than normal range, but this is lowest it should go based on the current bottom. This is the max loss and will trim this if the trading going bad
Upside Target +35% at $35.42
This is the last New High and will meet some resistance at this level. I will hold to see how it trades at this level. I will sell off half of my position at this level
IBD Rankings 09/20/19
Composite Rating: 86
EPS Rating: 77
RS Rating: 99
Group RS Rating: A+
SMR Rating: N/A
Acc/Dis Rating: D
ROE: 12.60% Debt: 1050% - Heavily Leveraged
Outstanding Shares: 122.0m
Float: 78.1m
EPS Due Date: 11/06/19 PE Ratio 344.84x
Ex-dividend date: None EPS % Chg (Last Qtr)900%
Dr Alexander has a triple screen for viewing charts and Trading for a Living is why I use the following charts
ENPH 5 Year Monthly from BigCharts 2019-09-20
ENPH 2 Year Weekly from BigCharts 2019-09-20
ENPH 3 Month Daily from BigCharts 2019-09-20
ENPH 3 Month Daily from StockCharts 2019-09-20
2019-10-23
I closed out of my position today, because I see the market continuing to be against me. Yesterday was a very bad day and the way I'm reading the tape is this is an active short. I normally play the long side, because it is psychologically fitting for me
There was a double bottom and I had been expecting things to turn for the better. The stock was at a convergence point with a collapsing trading range and a tightening of moving averages
Yahoo Finance Profile Description
OneMain Holdings, Inc., through its subsidiaries, provides consumer finance and insurance products and services. The company operates in two segments, Consumer and Insurance, and Acquisitions and Servicing. It provides secured and unsecured personal loans; credit insurance products, such as life, disability, and involuntary unemployment insurance products; non-credit insurance; and auto membership plans, as well as retail sales finance services. The company also services and holds real estate loans secured by first or second mortgages on residential real estate. As of December 31, 2018, it operated through a network of approximately 1,600 branches in 44 states in the United States, as well as through omf.com Website. The company was formerly known as Springleaf Holdings, Inc. and changed its name to OneMain Holdings, Inc. in November 2015. OneMain Holdings, Inc. was founded in 1920 and is based in Evansville, Indiana.
2019-08-20
This trade idea came to my yesterday while reviewing Investor's Business Daily Stocks on the Move and today was a follow through day
I have had some loses this month and has wiped out my gains for the year. So that being said I am hesitant in jumping back in with the current market condition. The overall market has been down for most of the month and I am currently only in Boston Scientific.
This stock has had a buy gap up and in candlestick lingo the window has been closed. It is now finding buyers again
I am placing a market order tomorrow to guarantee fulfillment. The current stock price is $39.02.
2019-08-21
I got filled at $39.43 this morning
Stop Loss -8% at $35.94
This stop is -$3.09 and this is a wider stop than I normally use. The stop is based on the chart where that level is -2% from the consolidation before the gap at $36.67
Upside Target +20% at $46.83
This will hit some resistance at $43 as it approaches the previous high. That would be about a 10% gain, but I suspect that it would go higher because of the recent trading. After it hits 43 I expect a 6 - 8 week pause forming a cup and handle pattern
IBD Rankings 08/20/19
Composite Rating: 90
EPS Rating: 70 - Caution
RS Rating: 91
Group RS Rating: B1
SMR Rating: B
Acc/Dis Rating: B
ROE: 12.6%
Debt: 400% - Heavily Leveraged
Outstanding Shares: 136.1m
Float: 130.6m
EPS Due Date: 10/29/19
Dr Alexander has a triple screen for viewing charts and Trading for a Living is why I use the following charts
OMF 5 Year Monthly from BigCharts 2019-08-20
OMF 2 Year Weekly from BigCharts 2019-08-20
BSX 3 Month Daily from BigCharts 2019-07-07
OMF 3 Month Daily from StockCharts 2019-08-20
2019-10-08
I closed out the position today and I was very wrong. It move against me and put me underwater. I had been on vacation and had not watched as closely as I should have. I did capture the dividend which was a reason to hold on this
I widened my stop a little lower based on the chart. It has broken lower and I threw in the towel
I bought 2 out of the money $36 call options with an expiration of Nov 15, 2019 as an earnings play. They announce October 28, 2019 after the close
I got filled at 1.55 and will be selling at or before the earnings announcement
OMF 3 Month Daily from StockCharts 2019-10-14
2019-10-29
The company reported earnings yesterday and I closed out of my position. I feel that I have regained positive position overall for this company and have captured a large portion of the upside
This trade idea came to me a while ago. I had bought this and was one day from my 7 Day Time Stop. It was on Day 5 the indicators I use looked like it was going to turn downward. I was already down I sold.
I first traded it on 2019-06-20 I placed the order late in the afternoon. On that trade
My cost basis: $41.86
-5% stop: $39.78
+20% Gain: $50.24
I kept that on my watch list and then I bought back in on 2019-07-01. This is a risky position, because earnings is 2 weeks away
JD.com is China’s largest online retailer and its biggest overall retailer. It offers customers the best online shopping experience. The company is a member of the Fortune Global 500.
2016-06-30
This trade idea came to me by reviewing Investors.com on 2019-06-26 Stocks on the Move. This is a Chinese on line retailer and I am hesitant in purchasing, because of the on going trade war with US and China. I went ahead and did purchase the following day in the afternoon
My cost basis: $30.47
-5% Stop: $28.88
+20% Gain: $36.48
Dr Alexander has a triple screen for viewing charts and Trading for a Living is why I use the following charts
JD 5 Year Monthly from BigCharts 2019-06-30
JD 2 Year Weekly from BigCharts 2019-06-30
JD 3 Month Daily from BigCharts 2019-06-30
JD 3 Month Daily from StockCharts 2019-06-30
2019-08-12
I had closed out this position on 2019-08-01 at a larger loss than my stop. I was up about 3%, but then the day before I was at about break even. Then the morning the stock bounced up and after lunch it crashed.
I got filled at 27.74
30.40 - 27.74 = -$2.66 / 30.40 = -8.75%
This loss caused me to reduce my overall exposure to the market and reevaluate my use of metal stops. I then took a break from the market to adjust my approach and scale back in to the market more cautiously
At H&R Block, we provide help and inspire confidence in our clients and communities everywhere. We’ve been true to this purpose since the beginning when brothers Henry and Richard Bloch founded the company in 1955. In that time, we’ve prepared more than 800 million tax returns. And we’ve grown to have company-owned and franchise retail locations in all 50 states, Puerto Rico and other U.S. territories, on U.S. military bases internationally and around the world.
This trade idea came to me by running a scan from TD Ameritrade on Wednesday. This company interred me and I set a buy order the next day
I set the scan to:
Revenue Growth: +25% - >100%
Current Price: $20 - $50
EPS Growth: 15% - >100%
Volume: >100,000sh
MACD Histogram: Negative to Positive
Price/Sales: 2, 2-3
I bought on Thursday 2019-06-05 in the afternoon, because I expected a dip. The stock had gone up 4 straight days and the MACDH had changed to positive. I am currently down a small percentage and looking to exit quick if it starts to move against me.
This Day 2 of a 7 Trading Day Time Stop. The IBD Rankings are below the CANSLIM standard
IBD Rankings 06/19/19
Composite Rating: 82
EPS Rating: 49
RS Rating: 90
Group RS Rating: A
SMR Rating: C
Acc/Dis Rating: C+
ROE: 95.32
Debt: 380%
Outstanding Shares: 203.3m
Float: 201.3m
EPS Due Date: 8/26/19
I got filled at $28.28
-5% Stop: $26.87
20% Target = $33.94
Dr Alexander has a triple screen for viewing charts and Trading for a Living is why I use the following charts
HRB 5 Year Monthly from BigCharts 2019-06-16
HRB 2 Year Weekly from BigCharts 2019-06-16
HRB 3 Month Daily from BigCharts 2019-06-16
HRB 3 Month Daily from StockCharts 2019-06-16
2019-06-24
I closed out the position today and got filled at $27.80. I had bought this on the MACDH positive cross over and that is about to cross back to negative. Also this had hit my 7 Trading Days Time Stop. Time to move on, but this is still on my watch list
Hibbett, headquartered in Birmingham, Alabama, is a leading athletic-inspired fashion retailer with more than 1,100 stores under the Hibbett Sports and City Gear banners, primarily located in small and mid-sized communities. Founded in 1945, Hibbett has a rich history of convenient locations, personalized customer service and access to coveted footwear, apparel and equipment from top brands like Nike, Jordan, Adidas, and Under Armour. Consumers can browse styles, find new releases, shop looks and make purchases online or in their nearest store by visiting www.hibbett.com or www.citygear.com. Follow us @hibbettsports and @citygear.
2019-05-28
This trade idea came to me by running a scan from TD Ameritrade on Monday and was part of my weekly review.
I set the scan to:
Revenue Growth: +25% - >100%
Current Price: $20 - $50
EPS Growth: 15% - >100%
Volume: >100,000sh
MACD Histogram: Negative to Positive
Price/Sales: 2, 2-3
I placed a limit order at the previous day's close $23.95 on Friday. The morning open higher as expected and then stayed there through lunch. I had checked the stock at 2:20 EST and I felt that I would not get filled. I cancelled the limit order and bought the company. Of course it then drifted down and I would have been filled anyway. I ended the day with a -2% loss - drat
This Day 1 of a 7 Trading Day Time Stop. The IBD Rankings are below the CANSLIM standard
This major online retailer came to my attention from Investor's Business Daily's Stocks on the Move yesterday. There was a gap up and their numbers were decent.
This is Day 1 of a 7 Trading Day Time Stop
I got filled at $37.96
-5% stop = $36.02
20% Target = $45.55
Dr Alexander has a triple screen for viewing charts and Trading for a Living is why I use the following charts
EBAY 5 Year Monthly from BigCharts 2019-04-25
EBAY 2 Year Weekly from BigCharts 2019-04-25
EBAY 3 Month Daily from BigCharts 2019-04-25
EBAY 3 Month Daily from StockCharts 2019-04-25
2019-05-13
I closed out my position today, because it hit my stop. I had thought this would have performed better. It broke down and the timing was not right. This will still be on my watch list for a while