DISH $41.68
This trade idea came to me by reviewing IBD Weekly VOL. 38 NO. 16 Week of July 26, 2021. I’ve tried modifying my stock screening and this is a test. Starting with an up and coming group
Monday Order
Buy to Open 3 DISH Aug 20 2021 41.5 Call Limit 2.05 = $615 total risk.
EPS Announcement trade.
If this hits +50% then I should get my money back and the rest is a free ride. I have 3x leverage on a slightly In-The-Money option
Focusing on the Groups that are in Top 40 Groups with Blue color. The idea is to catch a group that is accelerating
#26 Telecom
This week rank: 25
3 week rank: 82
6 week rank: 108
So this sector came to my attention. Going to the group in paper and copied the entire group. I focused on $20-$50 range
This is an earnings play with EPS Announcement coming due 08/07/21. This is 10 trading days out and at the shortest time frame I like to purchase
Looking at Aug 26 Days till Expiration. Monthly’s instead of the weekly’s, because there is more volume. ITM because it’s the closest strike price
DISH Aug 20 21
Strike Bid/Ask Vol Op Int
41.5 Call 2.03/2.09 0 73
42.0 Call 1.78/1.85 0 181
IBD Ratings for DISH
ChecklistRating
Composite Rating: 94
EPS Rating: 81
RS Rating: 74
Group RS Rating: A
SMR Rating: A
Acc/Dis Rating: B
IBD Market: Confirmed Uptrend
P/E Ratio: 10.75x
No dividend
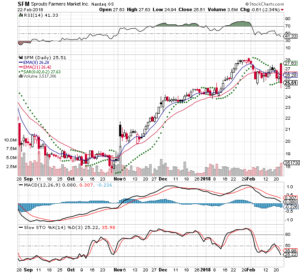
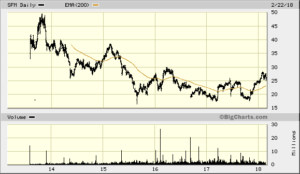
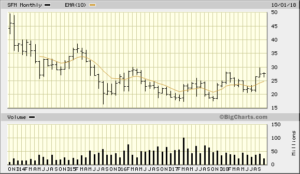
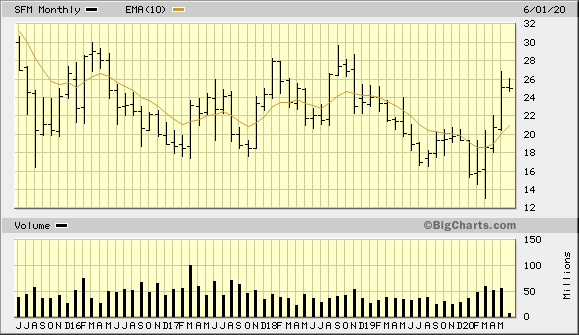
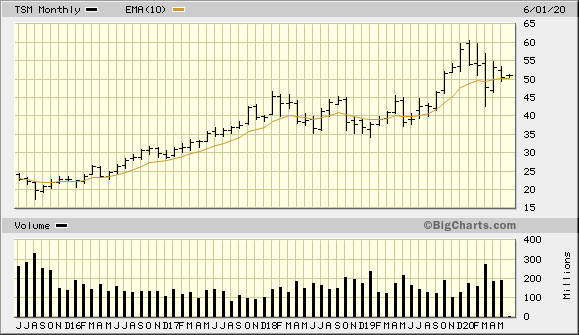
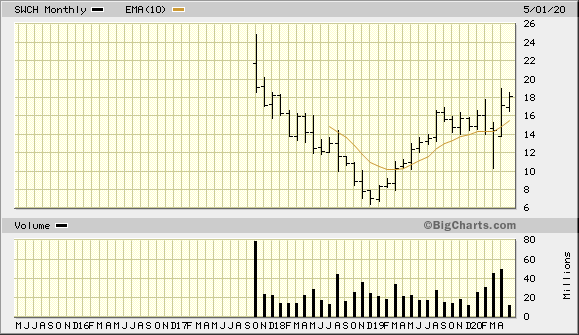
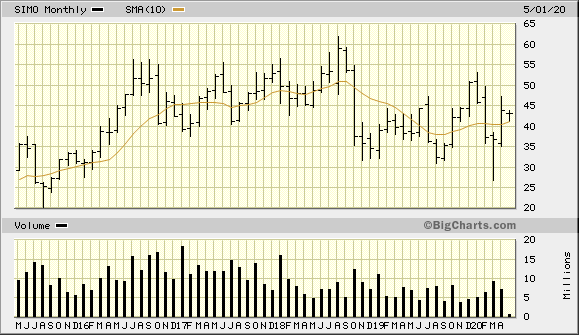
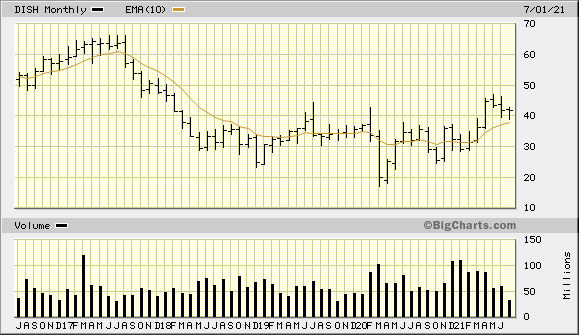
5yr Monthly from Bigcharts – Above 10 Month SMA. Forming a consolidation period after a Cup and Handle break out
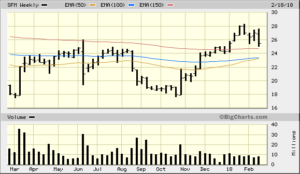
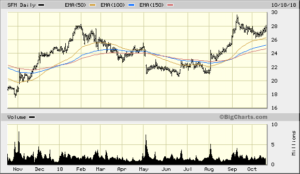
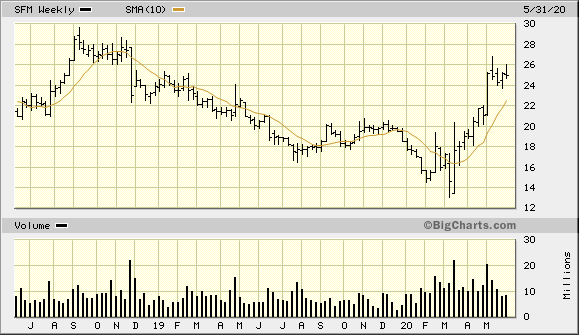
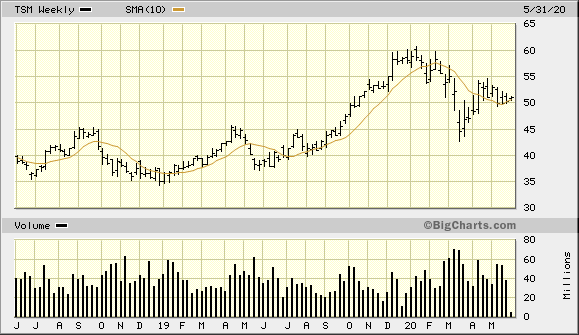
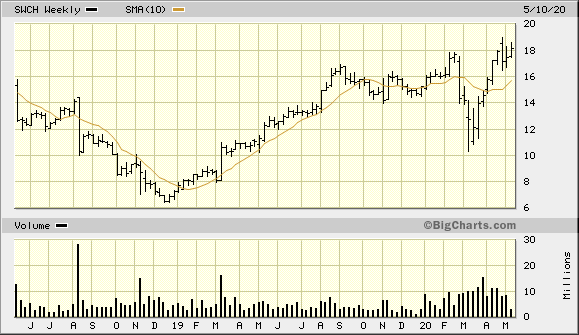
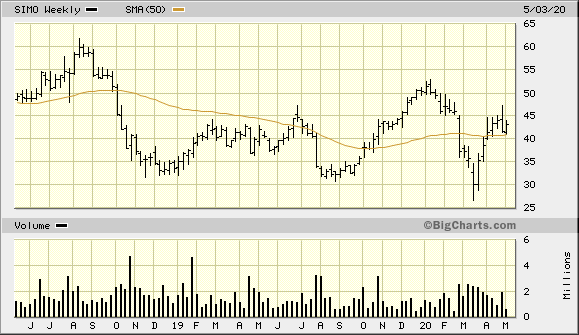
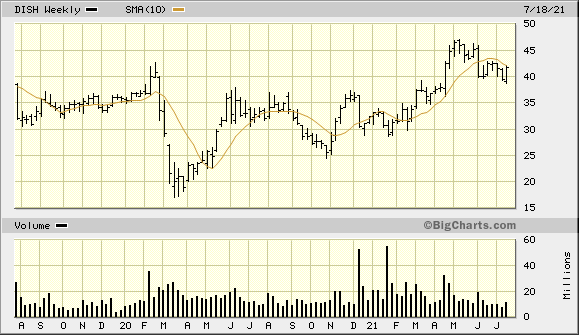
2yr Weekly from Bigcharts – Closed out the week at the 50 Week SMA
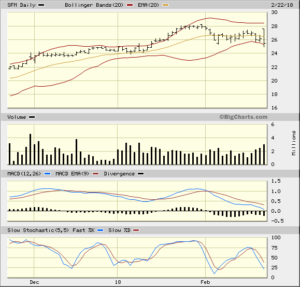
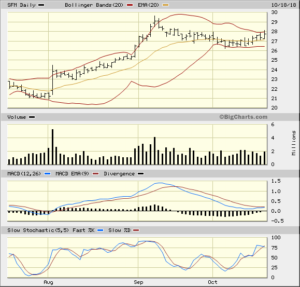
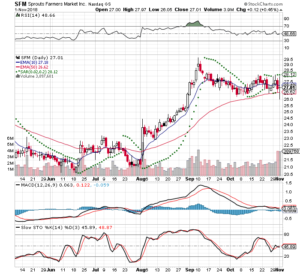
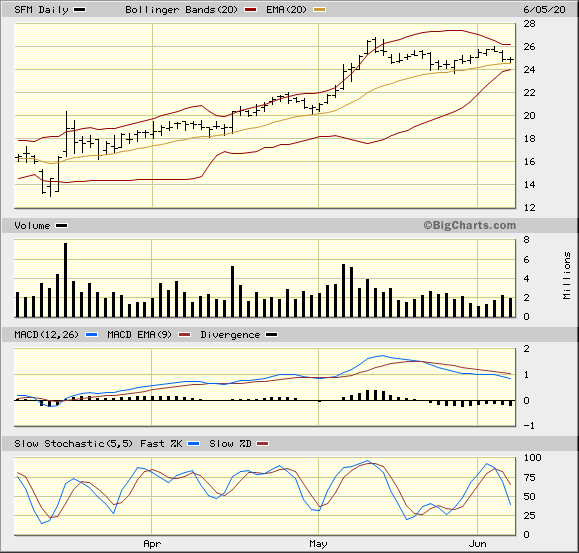
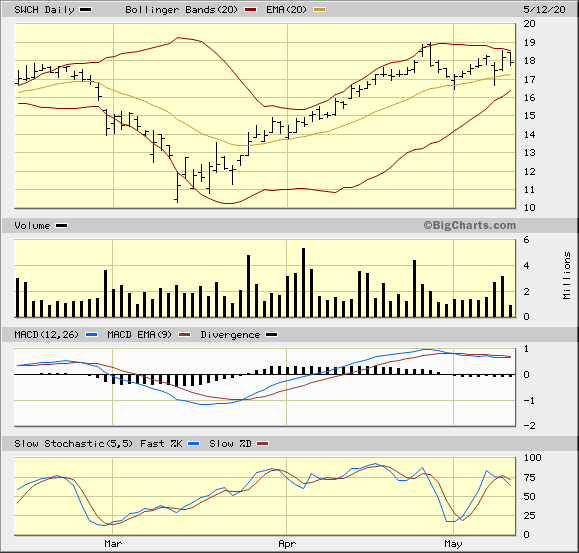
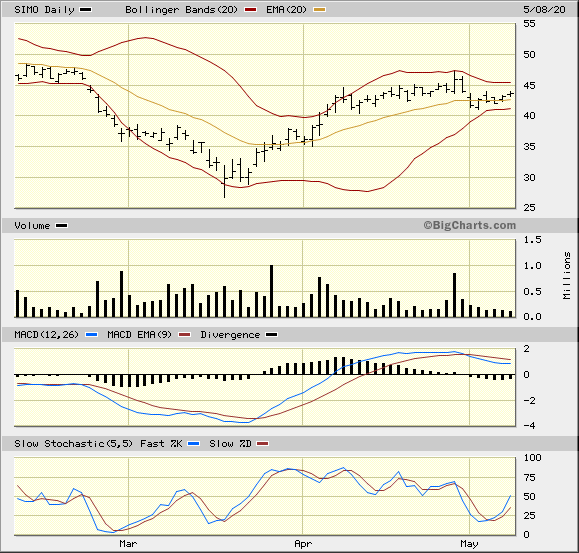
3mo Daily from Bigcharts – Above 20 EMA Bullish, Bollinger Bands contracting
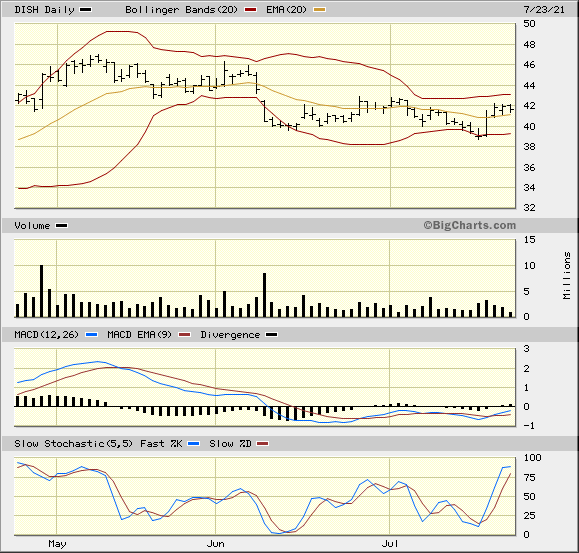
DISH 3 Month Daily from BigCharts 2021-07-23
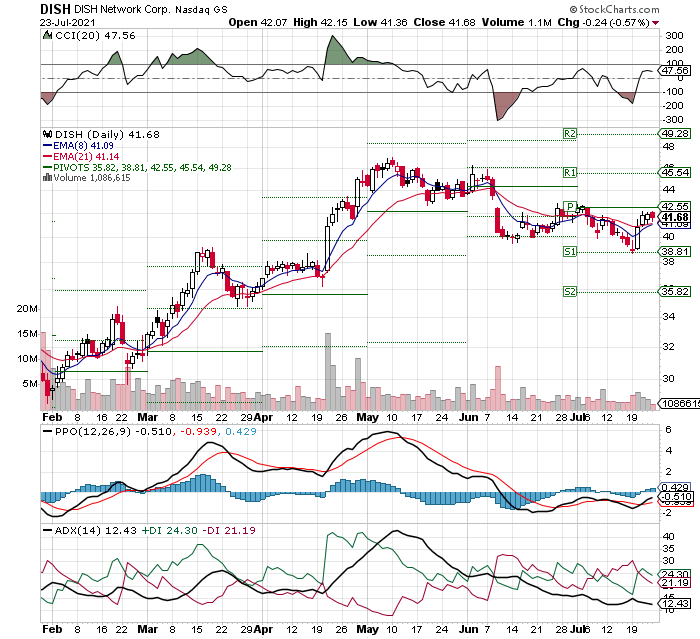
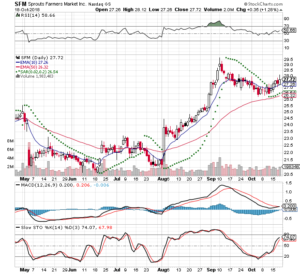
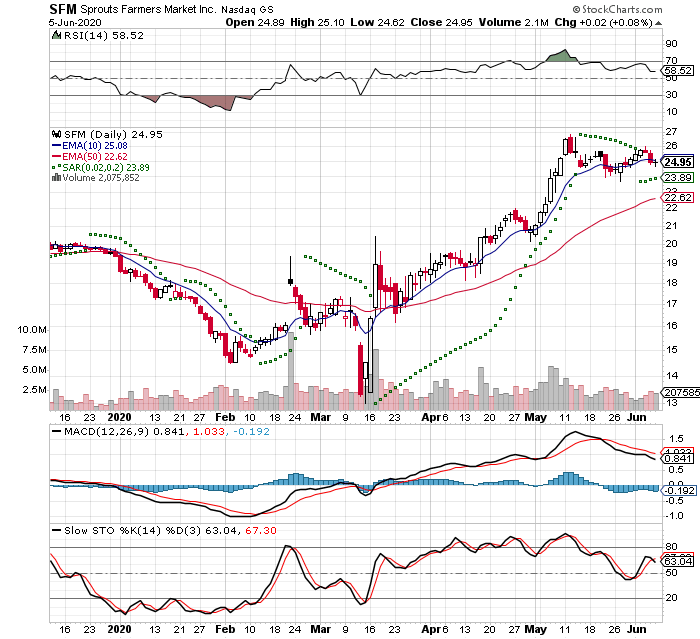
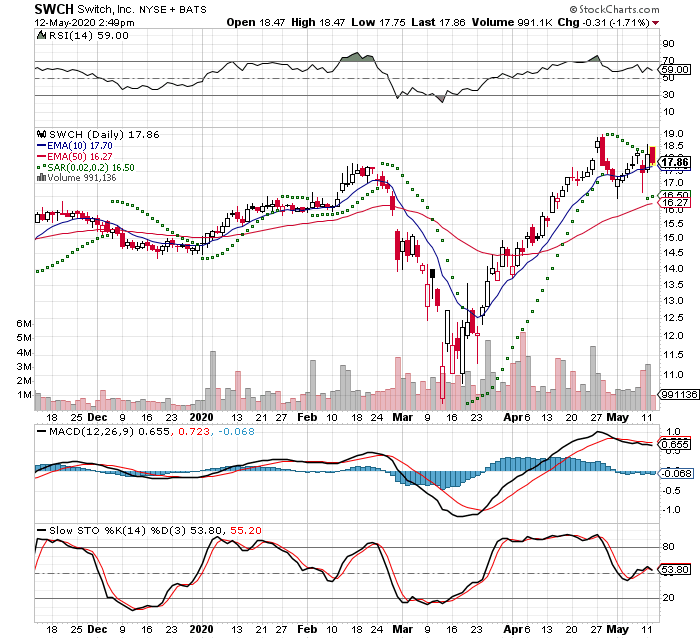
3mo Daily from StockCharts – My Standard Setup
RSI is midway 52.68
PSAR is below Bullish at 38.85. This is a floor the stop
10 Day EMA Above 41.04
50 Day EMA Above 41.32
MACD is trying to cross the zero line, but negative -.210. A strong trend is +/- 1
MACDH is already positive +.210.
Slow Stochastics is showing a positive trend 78.61
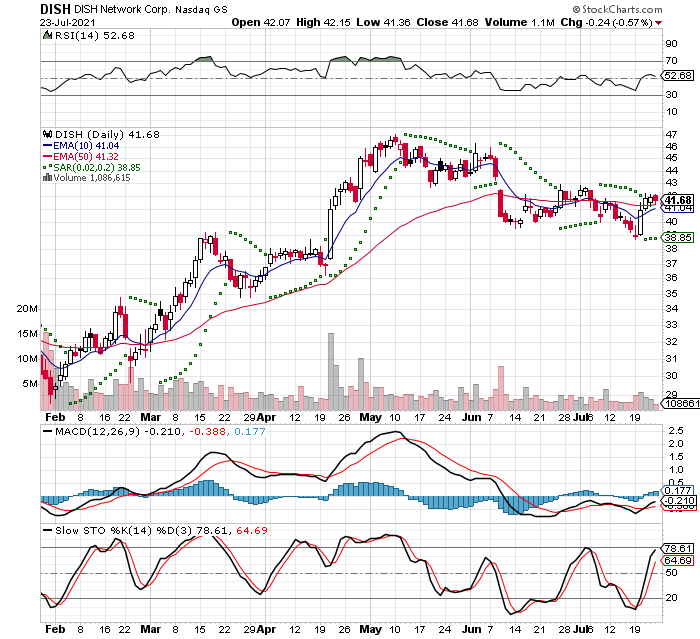
Jul 12th – 6 days of trading of complete selling. Then a large white candle on strong volume. 2 more days positive and Friday selling on light volume
Perfect Storm Trading additional screening