Getty Realty Corp Hld Co – GTY

GettyReality.com

From the company's About Us

Company Overview
Getty Realty Corp. (NYSE: GTY) is the leading publicly-traded real estate investment trust (“REIT”) in the United States specializing in the ownership, leasing and financing of convenience store and gasoline station properties.

Our 933 properties are located in 30 states across the United States and Washington, D.C. and are operated under a variety of brands including 76, BP, Citgo, Conoco, Exxon, Getty, Gulf, Mobil, Shell, Sunoco and Valero.

Our net lease portfolio consists of 814 properties leased to 26 regional and national fuel distributors under unitary or master triple-net leases and 104 properties leased as single unit triple-net leases.

2019-03-29

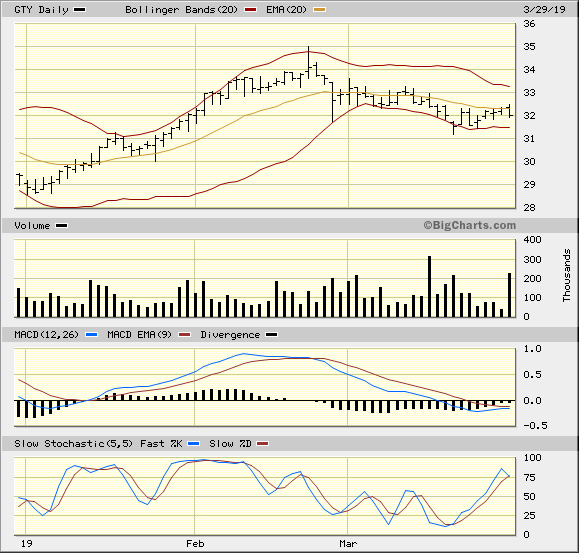
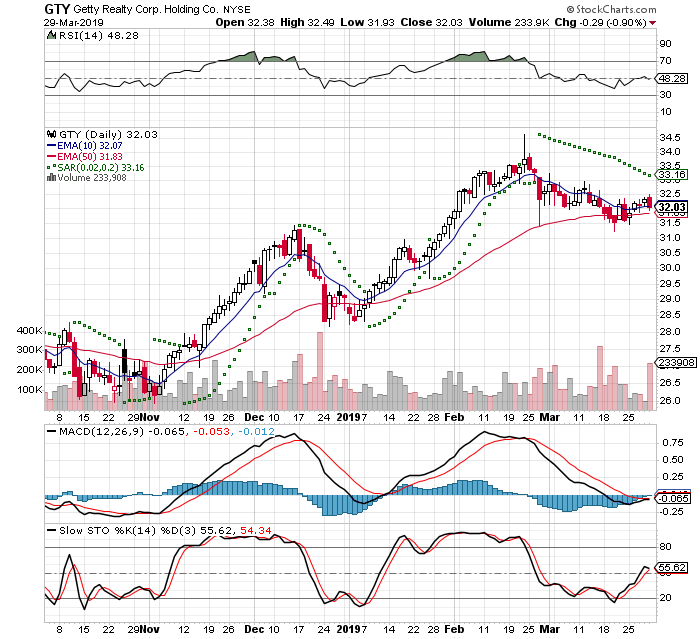
I had been watching this this company last year and had missed it earlier. This is in the process of bottoming out. I believe that the time is right, but this day had heavy selling and was down 1%

This is an example of the way I'm currently trading. I'm using this blog to document my trades and help educate others. Do your own due diligence

This is Day 1 of a 7 Trading Day Time Stop

I got filled at $32.40
-5% stop = $30.78
20% Target = $38.88

IBD Rankings 03/29/19
Composite Rating: 82
EPS Rating: 62
RS Rating: 82
Group RS Rating: A
SMR Rating: B
Acc/Dis Rating: D
ROE: 8.5%
Debt: 56%
Outstanding Shares: 40.9m
Float: 32.7m
EPS Due Date: 5/6/19

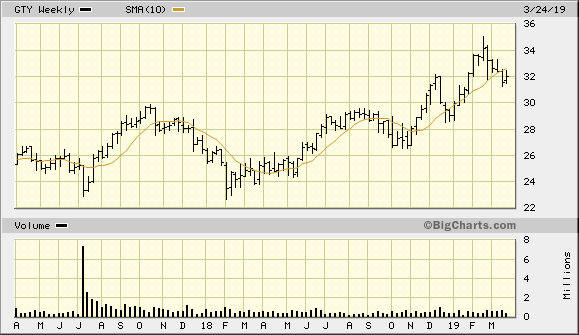
Dr Alexander has a triple screen for viewing charts and Trading for a Living is why I use the following charts
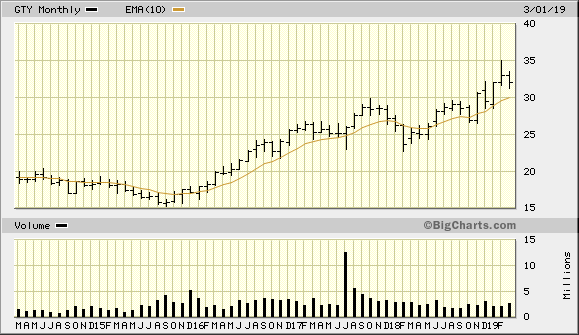
GTY 5 Year Monthly from BigCharts 2019-03-29
GTY 2 Year Weekly from BigCharts 2019-03-15
GTY 3 Month Daily from BigCharts 2019-03-29
GTY 3 Month Daily from StockCharts 2019-03-29

2019-04-17

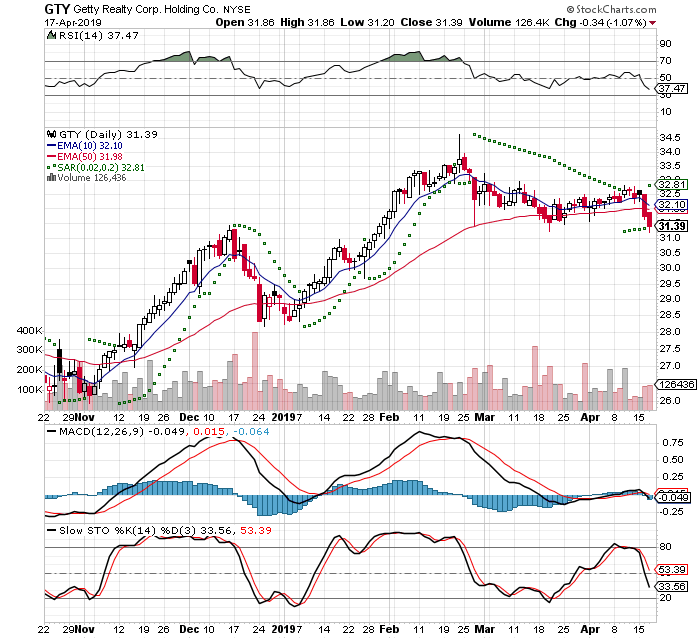
I had closed out this position yesterday at a small loss. I had a personal emergency and I was not able to perform the full review of how the day traded. I was up and then on yesterday it was losing. I closed out the trade and I got filled at $31.70

32.33 - 31.70 = - .63 / 32.22 = -1.9%

GTY 3 Month Daily from StockCharts 2019-04-17

Funko Inc Cl A – FNKO

Funko.com

2019-03-16 Saturday

This trade idea came from Investor's Business Daily Stocks on the Move on Thursday's edition 03/14. I had been watching this one for a while now and it's becoming active again. This company makes pop culture toys and accessories in US, UK, China, and Vietnam.

This first came to my attention 2018-09-18 when it was featured in the Stocks on the Move. I felt that it was still trending down, but i put it on a watch list. I watched it for the 4 months and put it on the back burner and focused my money on a more current issue.

I bought within the first hour of trading on Friday and that is Day 1 of a 7 Trading Day Time Stop.

I got filled at $21.33
-5% stop = $20..27
20% Target = $25.60

IBD Rankings 03/15/19
Composite Rating: 82
EPS Rating: 80
RS Rating: 98
Group RS Rating: D-
SMR Rating: B
Acc/Dis Rating: B
ROE: 28.9%
Debt: 164%
Outstanding Shares: 24.7m
Float: 5.94m
EPS Due Date: 5/13/19

Dr Alexander has a triple screen for viewing charts and Trading for a Living is why I use the following charts
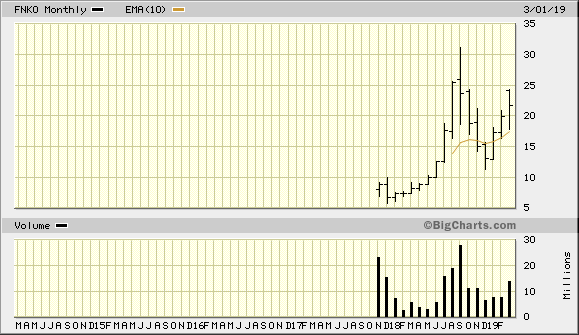
FNKO 5 Year Monthly from BigCharts 2019-03-15
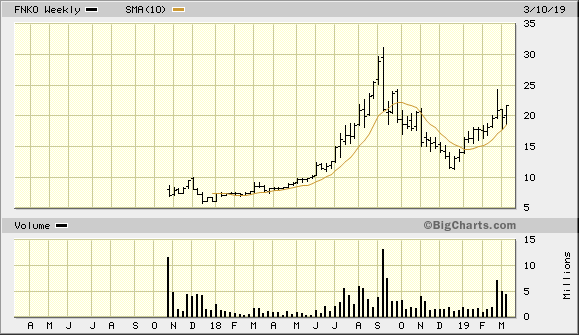
FNKO 2 Year Weekly from BigCharts 2019-03-15
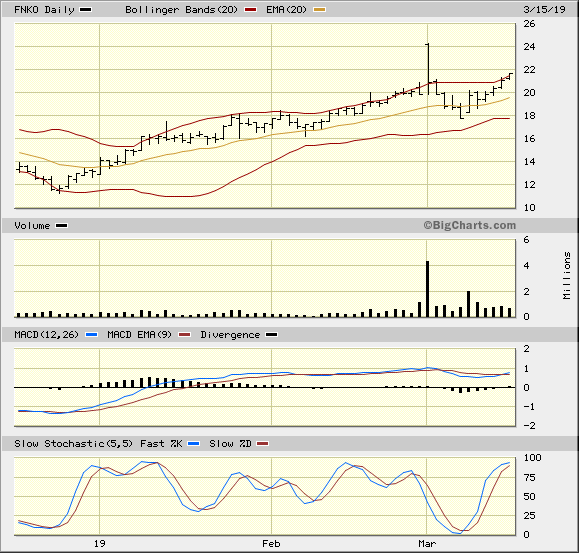
FNKO 3 Month Daily from BigCharts 2019-03-15
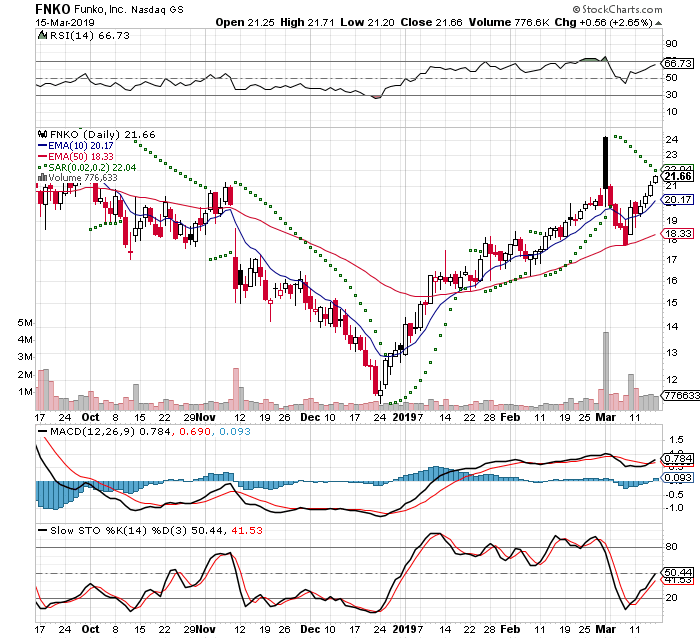
FNKO 3 Month Daily from StockCharts 2019-03-15

2019-03-23

I closed out my position, because of the overall market sell off. I am still watching the company and just think that the timing was not right.

I got filled at $20.41

21.33 - 20.41 = -.95 / 21.33 = -4.6% in 6 days

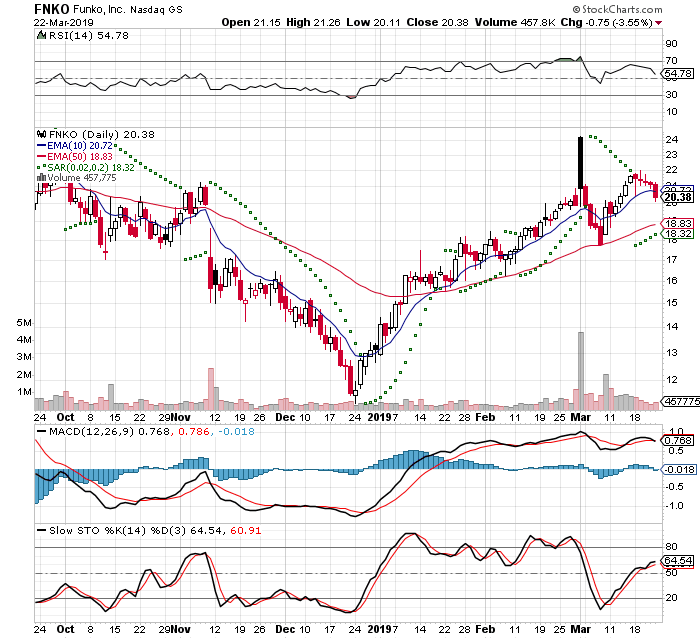
FNKO 3 Month Daily from StockCharts 2019-03-23

2019-03-26

I moved back into this company, because it was in Investor's Business Daily's Stocks on the Move this morning. It looked like it was starting to breakout, but it closed with only a slight gain. I'm down about -2% right out of the gate. Not a good start

This is Day 1 of a 7 Trading Day Stop

I got filled at $22.47
-5% stop = $21.357
20% Target = $29.97

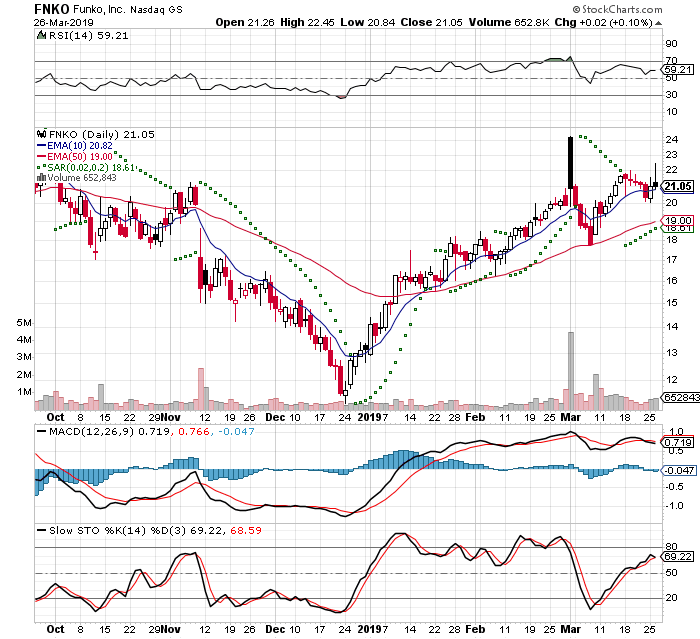
FNKO 3 Month Daily from StockCharts 2019-03-26

2019-04-17

I closed this out at a large loss on 2019-04-15. I had a bad start and a wide stop. I had a personal emergency that did not allow my normal review of each day's trading.

I got filled at 19.92

22.47 - 19.92 = -510 / 22.47 = -11.3%

This is tuition for not closing out a losing position when I was not able to do a full review each day

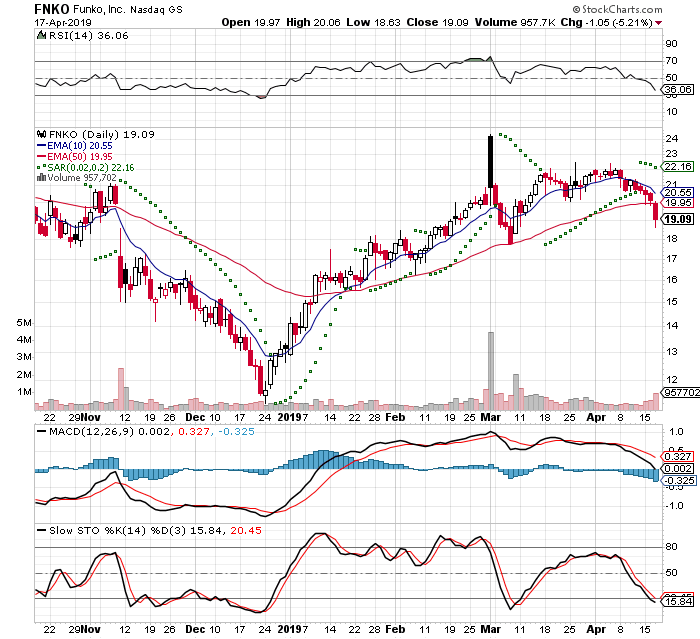
FNKO 3 Month Daily from StockCharts 2019-04-17

Mimecast Limited – MIME

2019-03-13

This trade idea came from Investor's Business Daily Stock's on the Move yesterday. There was a large spike in volume and had a good gain. This is attempting to buy on the dip.

I had started watching this after the pop on Feb 12th. This was featured on the Stocks on the Move. I thought it was a buyable gap up, but I did not act on it at the time. I had missed it and I was not going to chase it.

See In The Trading Cockpit with the O'Neil Disciples: Strategies that Made Us 18,000% in the Stock Market

I placed a market order for 100 shares after the open. This Day 2 of a 7 Trading Day Time Stop

I got filled at $45.95
-5% stop = $43.66
20% Target = $55.14

IBD Rankings 03/12/19
Composite Rating: 94
EPS Rating: 73
RS Rating: 90
Group RS Rating: A+
SMR Rating: C
Acc/Dis Rating: B-
ROE: 0%
Debt: 68%
Outstanding Shares: 60.1m
EPS Due Date: 5/13/19

Dr Alexander has a triple screen for viewing charts and Trading for a Living is why I use the following charts
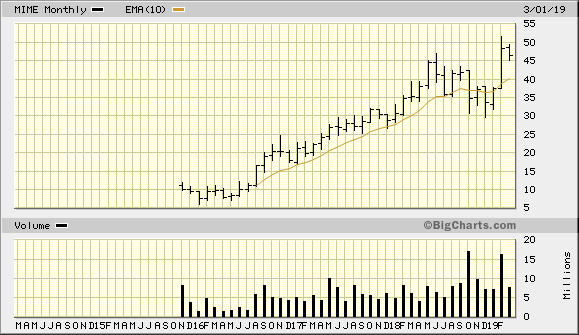
MIME 5 Year Monthly from BigCharts 2019-03-14
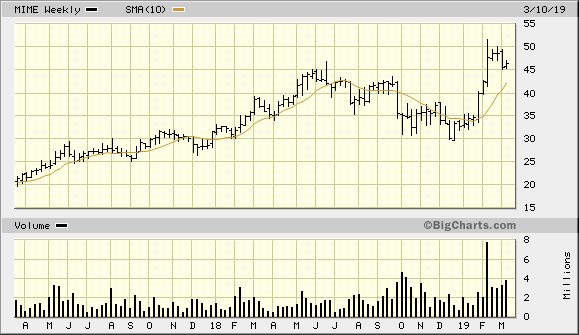
MIME 2 Year Weekly from BigCharts 2019-03-14
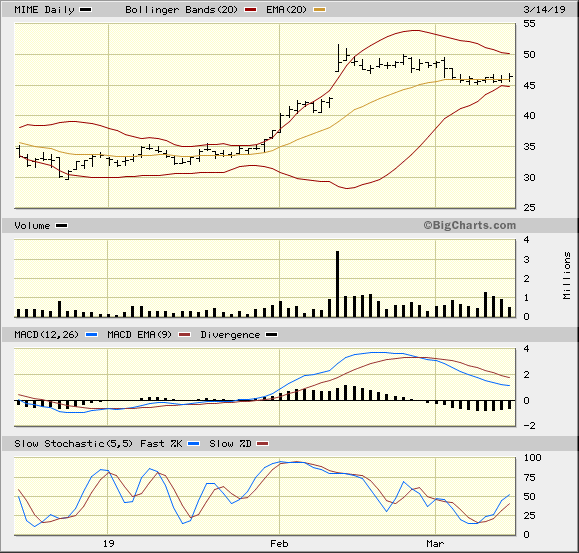
MIME 3 Month Daily from BigCharts 2019-03-14
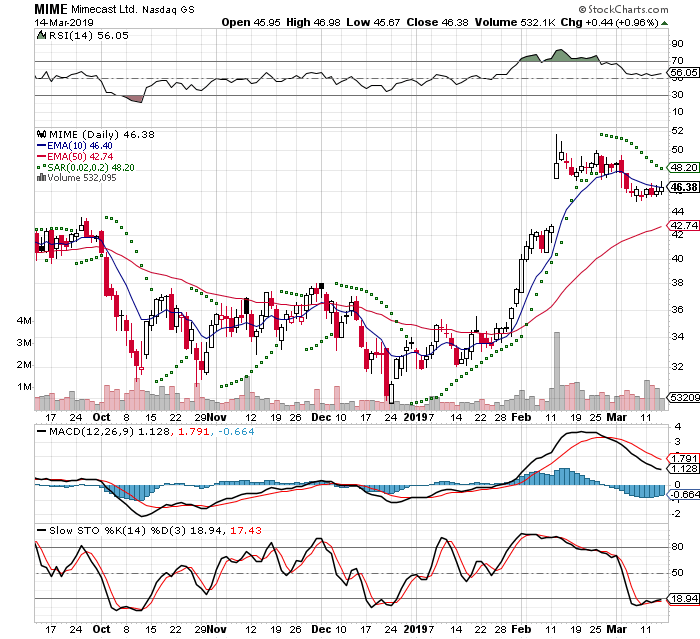
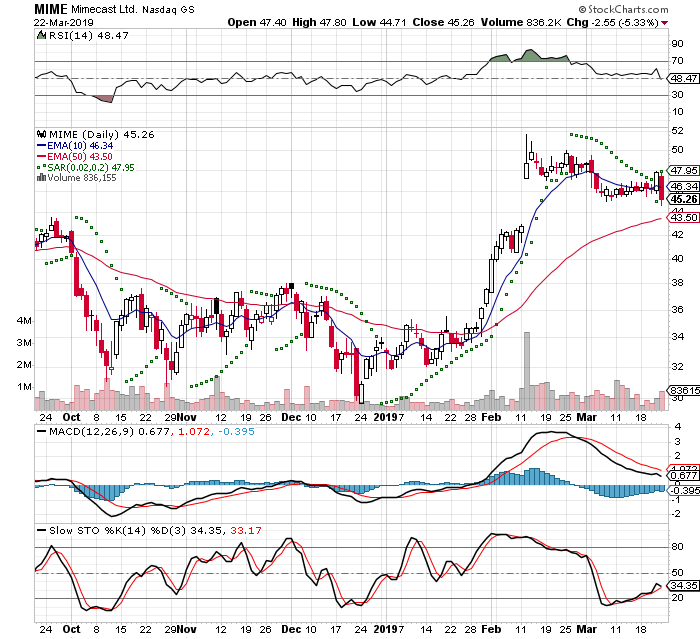
MIME 3 Month Daily from StockCharts 2019-03-14

2019-03-23

I closed out the position today, because of the overall market conditions. I was up about 4% on Thursday 03-21 and Friday the gain that had disappeared in the general market breakdown.

I got filled at $44.94

45.95 - 44.94 = -1.01 / 45.95 = -2.2%

MIME 3 Month Daily from StockCharts 2019-03-23

Essent Group Ltd – ESNT

2019-03-06

I had been following this stock off and on for a while. A couple year's ago they had a great run up and I had missed it at the time. This was frequently featured in Investor's Business Daily IBD50 and was one of the best stocks of the year.

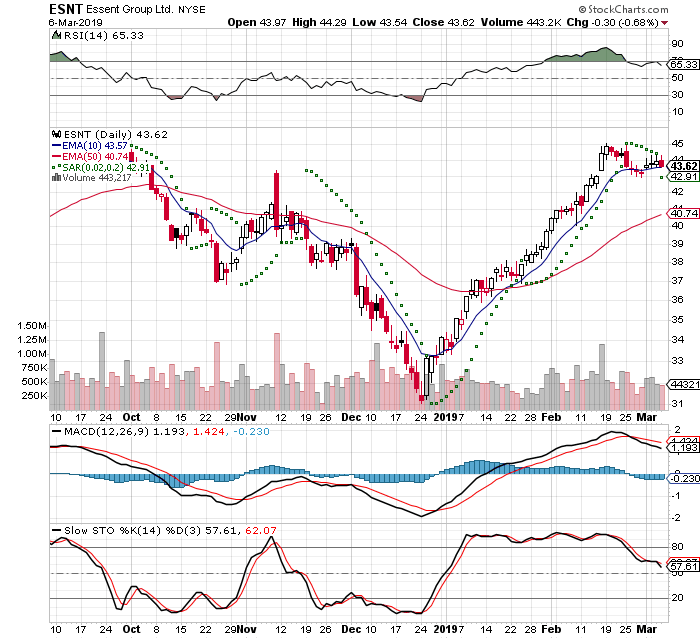
Then a little while back a friend asked me about this. It had a good run up since December and I wanted to wait for a dip. I put it on a watch list and I saw the PSAR flip below and that is a bullish signal. The way I was reading the tape - Accumulatin/Distribution I do not see any strong selling

I placed a market order for 100 shares about 11:30, because it had held and was a little off the previous day's close. This Day 2 of a 7 Trading Day Time Stop

I got filled at $44.08
-5% stop = $41.88
20% Target = $52.89

IBD Rankings 03/06/19
Composite Rating: 99
EPS Rating: 99
RS Rating: 86
Group RS Rating: A+
SMR Rating: A
Acc/Dis Rating: A-
ROE: 21.7%
Debt: 0%
Outstanding Shares: 98.3m
EPS Due Date: 5/2/19

Dr Alexander has a triple screen for viewing charts and Trading for a Living is why I use the following charts
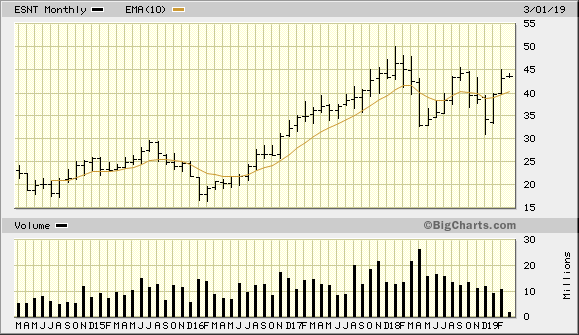
ESNT 5 Year Monthly from BigCharts 2019-03-06
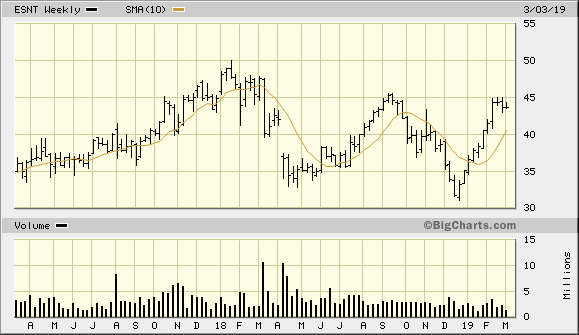
ESNT 2 Year Weekly from BigCharts 2019-03-06
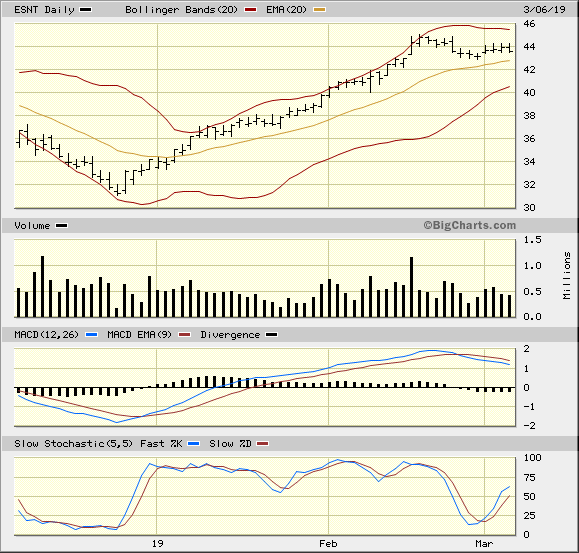
ESNT 3 Month Daily from BigCharts 2019-03-06
ESNT 3 Month Daily from StockCharts 2019-03-06

2019-03-07

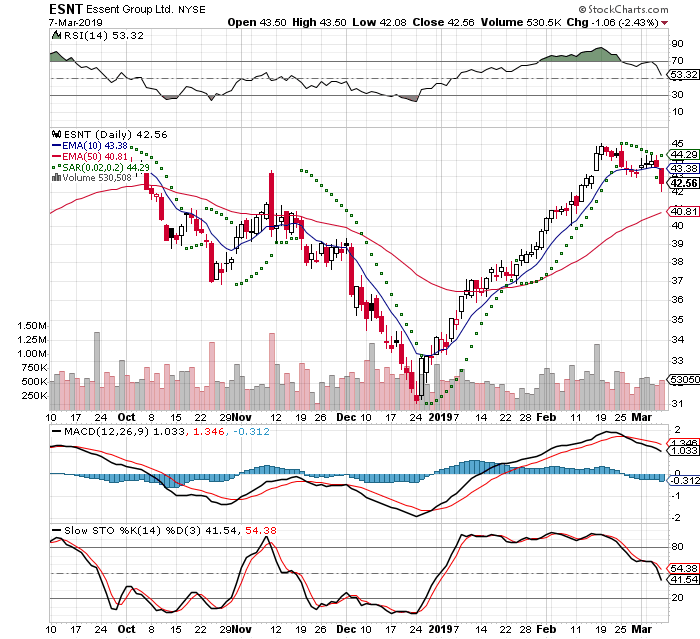
I closed out of the position today, because I had expected a minor bounce and it had a small gap down. It was not recovering by midday and I cut the losses at about 3%.

I got filled at 42.64

44.08 - 42.64 = 1.44 / 44.08 = -3.3% 2 days

ESNT 3 Month Daily from StockCharts 2019-03-07

2019-03-18

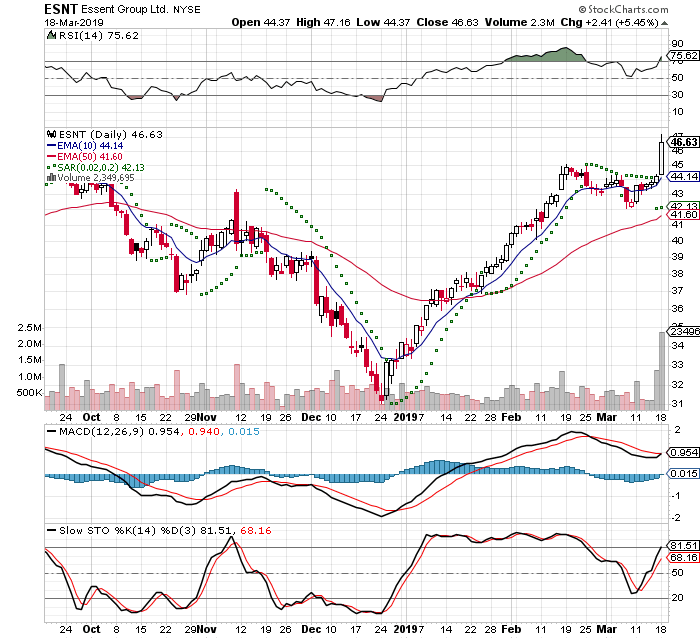
I moved back into this company this morning. Friday it had started the breakout and was drawing the attention. Today was a good day +5.45% on +447% volume

I got filled at 44.55
-5% Stop: 42.33
+20% Target: 55.96

ESNT 3 Month Daily from StockCharts 2019-03-18

2019-03-24

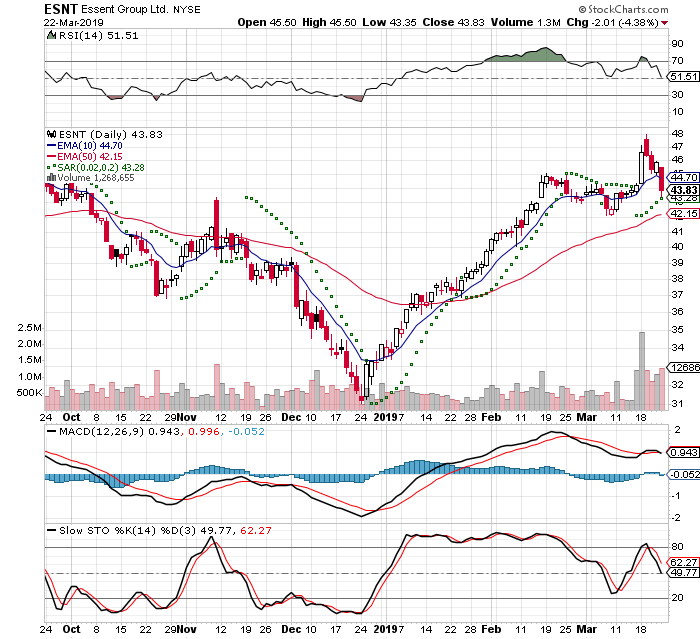
I closed out my position, because of the general market sell off. This was close to reaching my -5% stop. Friday was a clear distribution day and reversed the overall trend.

The original entry point was incorrect, because I had gotten a bad fill. The market was at $44.55, but I actually got filled at $46.20. Thursday I was sitting on a gain and by lunch I was at a loss. I closed out to be completely in cash to reevaluate the market

I got filled at 43.91

46.20 - 43.91 = -2.29 / 46.20 = -5.00

Not good, but I walked away

ESNT 3 Month Daily from StockCharts 2019-03-23

Health Ins Innovations A – HIIQ

2019-02-21

This trade idea came to from reading Investors Business Daily IBD Weekly Vol 35 NO 46 Week of Feburary 18, 2019. It was featured in IBD50 and it was ranked #24. I added this to my watch list on Sunday. Monday the market was closed for Presidents Day and opened again on Tuesday. Tuesday it stared to move on good volume

I placed a market order for 100 shares after dipping a little at the open and got a decent fill. There are a couple of warning signs. This is a thinly traded company and earnings are being announced soon. This Day 2 of a 7 Trading Day Time Stop

I got filled at $43.01
-5% stop = $40.80
20% Target = $51.53

IBD Rankings 02/21/19
Composite Rating: 99
EPS Rating: 94
RS Rating: 94
Group RS Rating: A+
SMR Rating: A
Acc/Dis Rating: B-
ROE: 41.1%
Debt: 0%
Outstanding Shares: 14.4m
EPS Due Date: 2/26/19

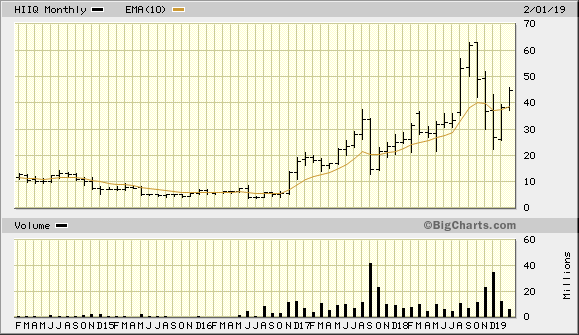
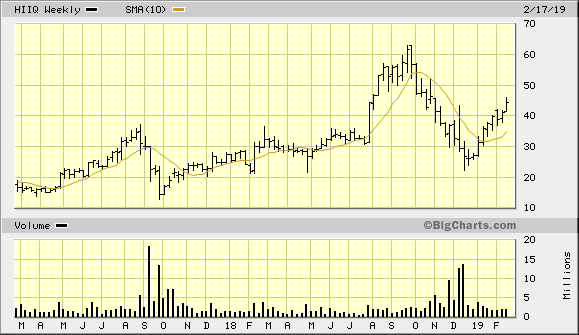
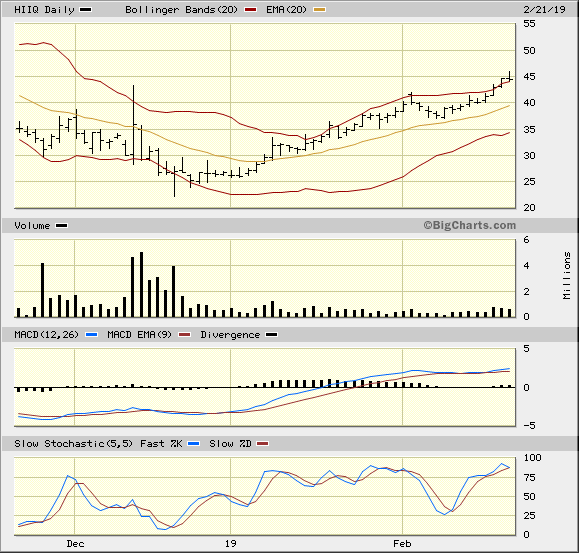
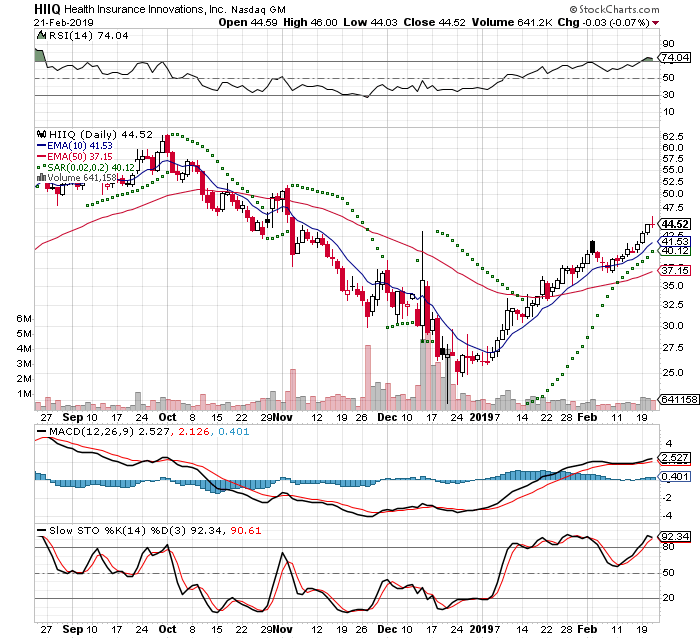
Dr Alexander has a triple screen for viewing charts and Trading for a Living is why I use the following charts

HIIQ 5 Year Monthly from BigCharts 2019-02-21
HIIQ 2 Year Weekly from BigCharts 2019-02-21
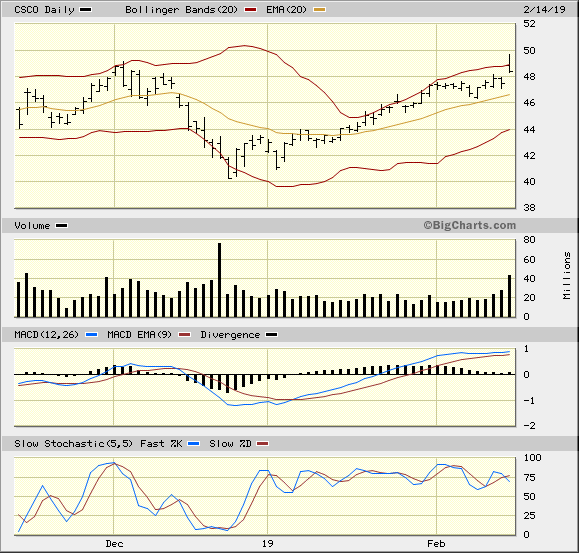
CSCO 3 Month Daily from BigCharts 2019-02-14
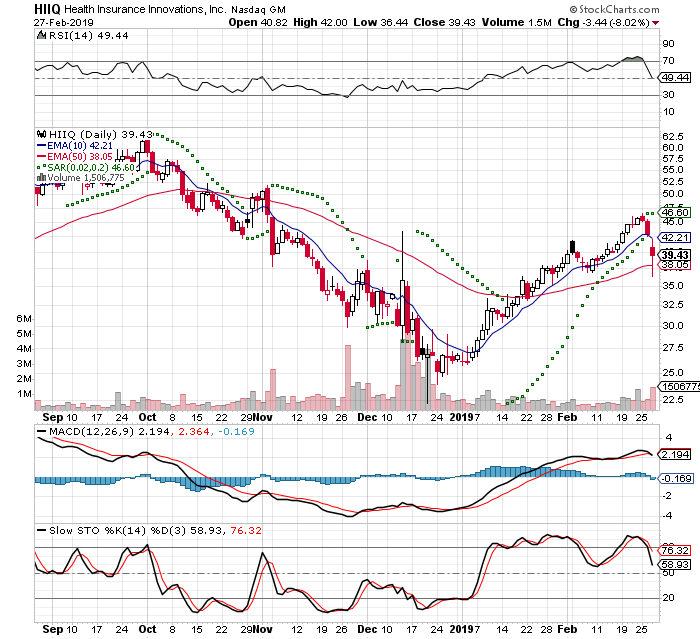
HIIQ 3 Month Daily from StockCharts 2019-02-21

2019-02-27

I closed my position today, because of a stop loss.

I had been up $250 (5-6%) and went down $200 in the past 2 days.

The first drop came yesterday. When the earnings date got moved it dropped 5% that day, but it was on about 63% volume. It was close just under my break even level and I held my ground hoping for a bounce.

It did not come today and in fact it dropped even worse. It opened down and a sold a little after 9 CST. It happened to be close to the high of the day.

I got filled at 40.82

43.01 - 40.82 = -2.19 / 43.01 = -5.1% in 6 Trading Days

HIIQ 3 Month Daily from StockCharts 2019-02-27

Cisco Systems Inc – CSCO

2019-02-14

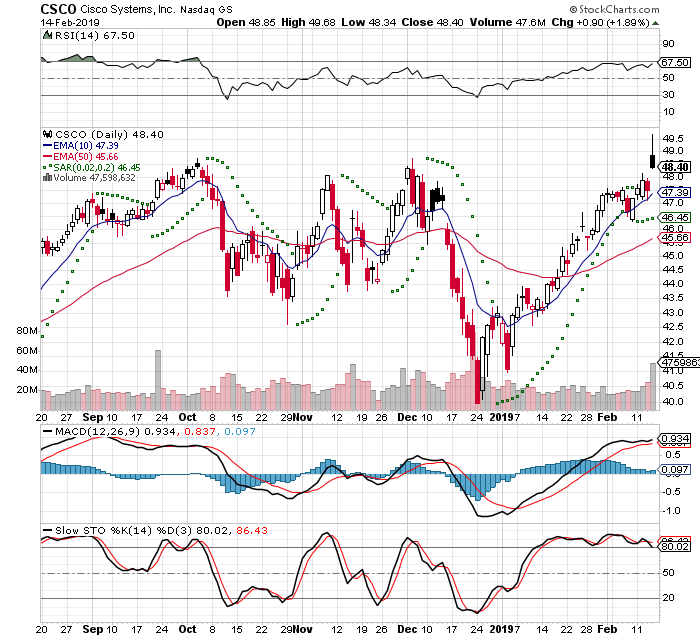
I bought this around 11 AM CST. This was featured in the IBD Stocks on the Move today. They reported earnings this morning and it popped. This was an impulsive trade and really didn't research it. The chart is sloppy and not really confident in this trade

It was a buyable gap up and check out the setup: In The Trading Cockpit with the O'Neil Disciples: Strategies that Made Us 18,000% in the Stock Market

This Day 1 of a 7 Trading Day Time Stop. The IBD Rankings are below the CANSLIM standard

I got filled at $48.86
-5% stop = $46.42
20% Target = $58.63

IBD Rankings 02/14/19
Composite Rating: 73
EPS Rating: 76
RS Rating: 82
Group RS Rating: D-
SMR Rating: A
Acc/Dis Rating: D+
ROE: 23.2%
Debt: 47%
Outstanding Shares: 4496.0m
EPS Due Date: 5/16/19

Dr Alexander has a triple screen for viewing charts and Trading for a Living is why I use the following charts

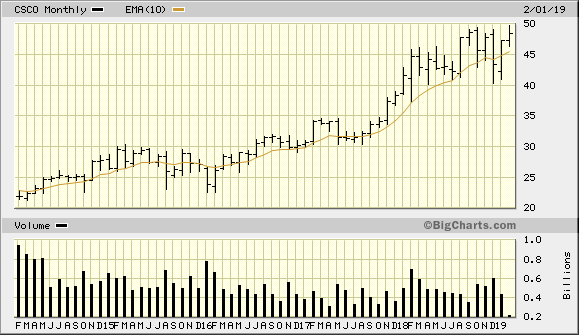
CSCO 5 Year Monthly from BigCharts 2019-02-14
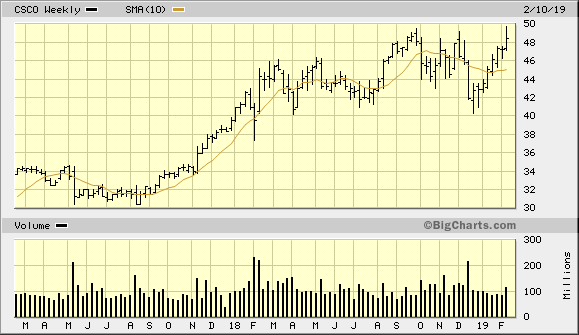
CSCO 2 Year Weekly from BigCharts 2019-02-14
CSCO 3 Month Daily from BigCharts 2019-02-14
CSCO 3 Month Daily from StockCharts 2019-02-14

2019-03-03

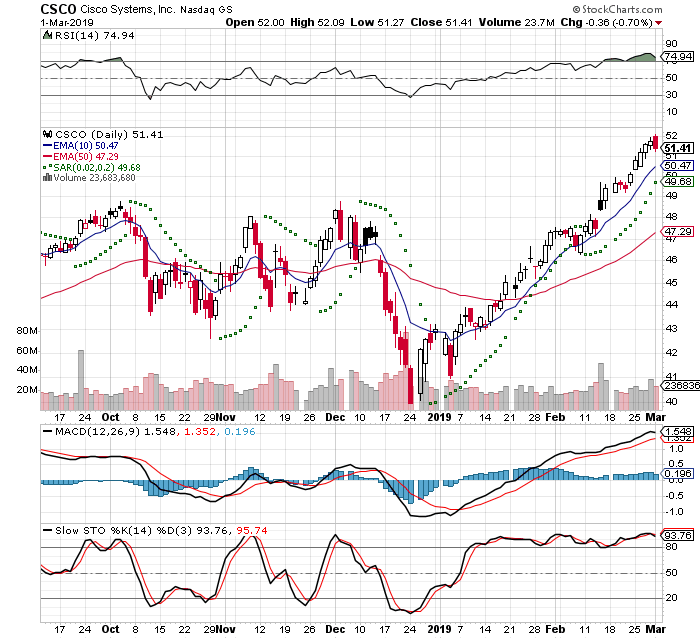
I closed out of this position in order to be all in cash. I had made a couple of bad trades and wanted to take a step back. I will be scaling back in as the opportunities as the pop. I got filled at $51.78

51.78 - 48.86 = 2.92 / 48.86 = 5.9%

CSCO 3 Month Daily from StockCharts 2019-03-01

Boot Barn Holdings Inc – BOOT

Bootbarn.com

2019-02-07

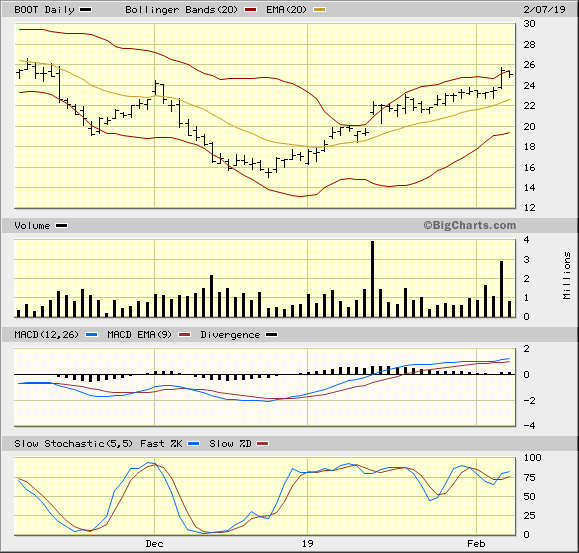
I did not like the way ZScaler was trading and wanted to move out of that. I felt this was a better use for the cash. This was featured in IBD's Stocks on the Move yesterday. This company was featured in IBD last year and I had passed on it for one reason or another. They had posted earnings and had a large positive move.

Today is Day 1 of a 7 Trading Day Time Stop.

I got filled at $47.60
-5% stop = $45.00
20% Target = $57.00

IBD Rankings 02/07/19
Composite Rating: 89
EPS Rating: 87
RS Rating: 87
Group RS Rating: B-
SMR Rating: C
Acc/Dis Rating: B
ROE: 10.9%
Debt: 89%
Outstanding Shares: 28.3m
EPS Due Date: 5/15/19

Dr Alexander has a triple screen for viewing charts and Trading for a Living is why I use the following charts

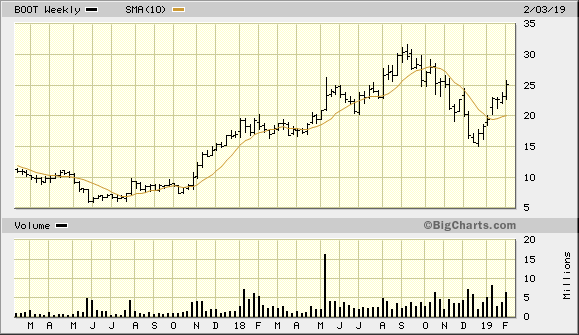
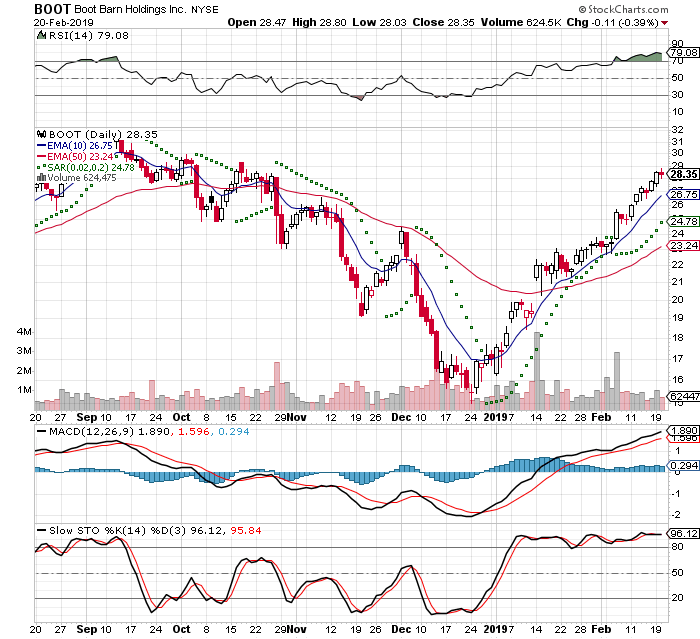
BOOT 5 Year Monthly from BigCharts 2019-02-07
BOOT 2 Year Weekly from BigCharts 2019-02-07
BOOT 3 Month Daily from BigCharts 2019-02-07
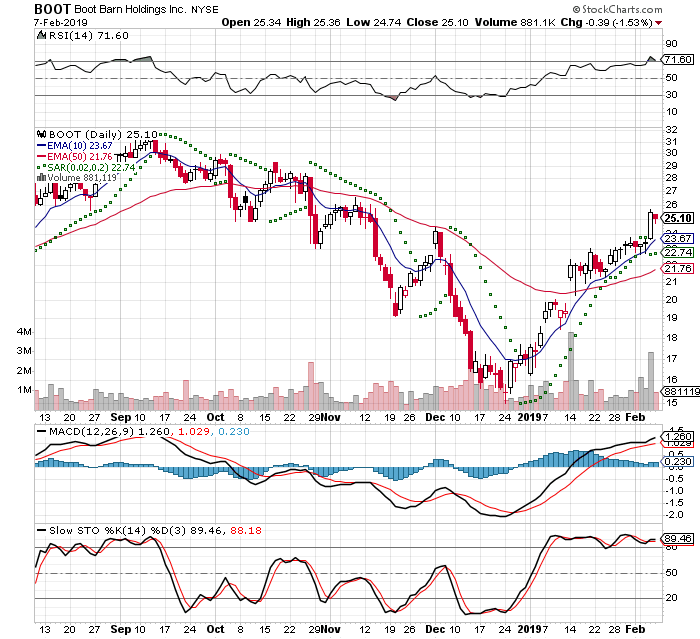
BOOT 3 Month Daily from StockCharts 2019-02-07

2019-02-20

I closed out my position and locked in a gain. This had been rising on light volume and it was still trending higher. I will still be watching this company and may decide to get back in after a dip

I got filled at $28.34

28.34 - 25.32 = 3.02 / 25.32 = 11.9% in 13 days. Not bad
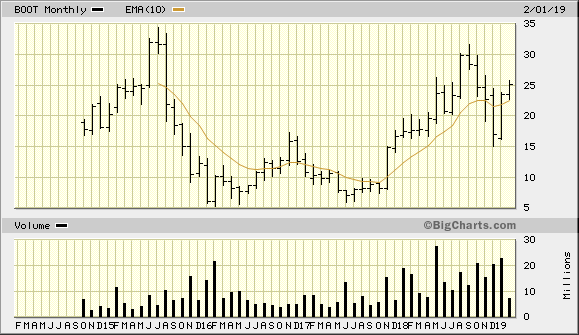
BOOT 3 Month Daily from StockCharts 2019-02-20

Radware Limited – RDWR

radware.com
radware.com

2019-01-27

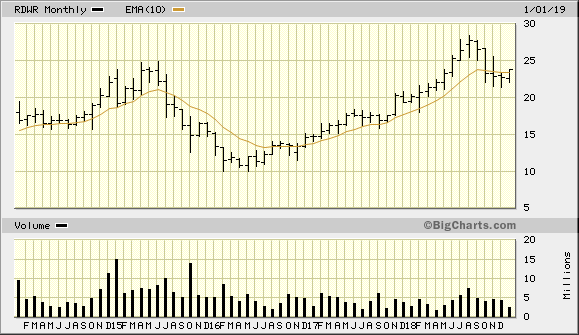
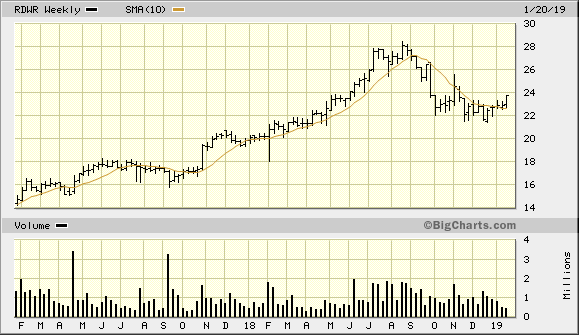
This trade idea came to me a few weeks ago when I was reviewing the IBD Stocks on the Move. It appeared there on last year 2018-12-26. There was a spike in volume and I added it to my watch list. This is a cloud based security service

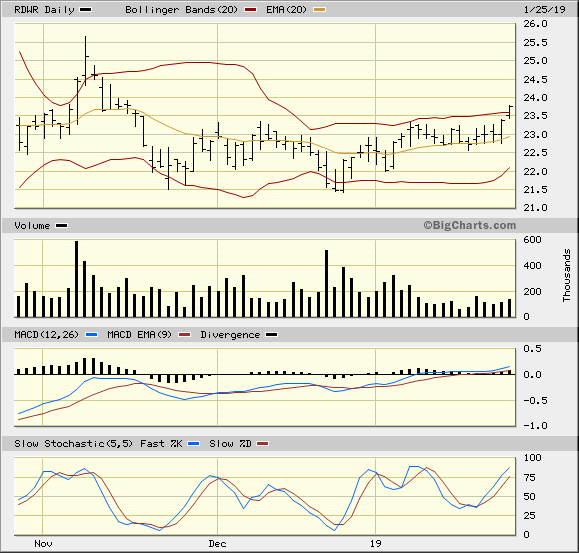
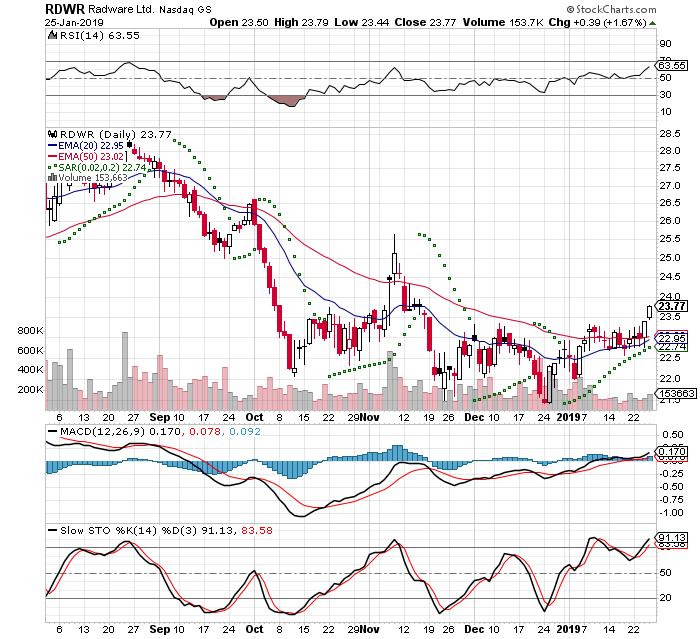
I had closed out Denny's and had cash available. The MACD has crossed the zero line, the 10 day EMA is crossing the 50 day EMA, and the MACDH is positive. The timing of this seemed about right and I bought Friday 2019-01-25.

This had a gap up, but it was on light volume and was hoping for more conviction. Friday was Day 1 of a 7 Day time stop. I limit my trades by 7 trading days, because if a stock is not acting correctly (being positive) buy this time then my capital can be put to better use elsewhere

I got filled at $23.67
-5% stop = $22.50
20% Target = $28.00

IBD Rankings 12/16/18
Composite Rating: 99
EPS Rating: 84
RS Rating: 94
Group RS Rating: A
SMR Rating: B
Acc/Dis Rating: A-
ROE: 5.7%
Debt: 82%
Outstanding Shares: 212.8m
EPS Due Date: 2/20/19

Dr Alexander has a triple screen for viewing charts and Trading for a Living is why I use the following charts

RDWR 5 Year Monthly from BigCharts 2019-01-27
RDWR 2 Year Weekly from BigCharts 2019-01-27
RDWR 3 Month Daily from BigCharts 2019-01-27
RDWR 3 Month Daily from StockCharts 2019-01-27

2019-02-05

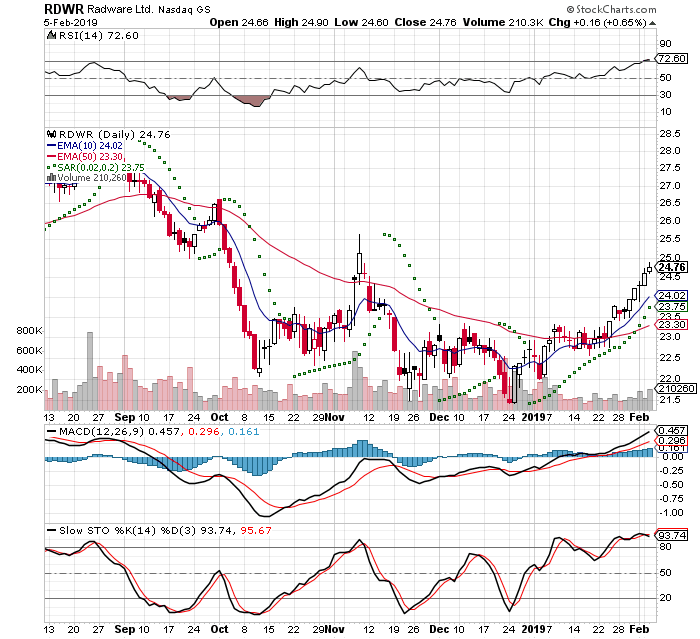
I sold today, because I did not want to hold during earnings and it was Day 7 for my time stop.

This has had a good run up and feel that it would have to have great earnings in order to maintain this pace of advance. It was progressing on light volume and was not comfortable holding. This will still be on my watch list for awhile.

I got filled at $24.72

24.72 - 23.67 = 1.05 /23.67 = 4.4% 8 days

That's not bad. A trade can easily cut against you. I'll take the profit

RDWR 3 Month Daily from StockCharts 2019-02-05

Docusign Inc – DOCU

2019-01-14

This came to my attention when I was looking at the IBD Stocks on the Move. I had some room in my portfolio as part of my Risk Management. I saw this coming out of a base on strong volume. I opened a position the next morning

I bought on 2019-01-11 and I am currently at Day 2 for a 7 Trading Day Time Stop. The stock has sold off some, but the volume dried up

I did a quick check on the IBD Rankings. These are a little less than the classic CANSLIM method, but based on my reading of the market I was willing to risk the trade.

IBD Rankings 01/14/19
Composite Rating: 83
EPS Rating: 72
RS Rating: 75
Group RS Rating: A
SMR Rating: D
Acc/Dis Rating: C
ROE: 0%
Debt: 0%
Outstanding Shares: 165.2m
EPS Due Date: 2/26/19

Dr Alexander has a triple screen for viewing charts and Trading for a Living is why I use the following charts

DOCU 5 Year Monthly from Bigcharts 2019-01-14

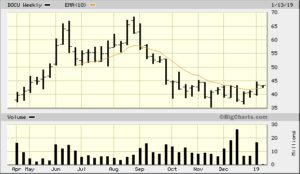
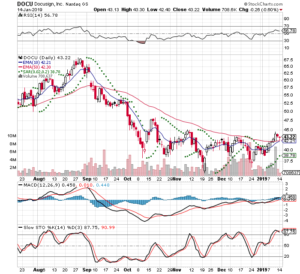
DOCU 1 Year Weekly from Bigcharts 2019-01-14

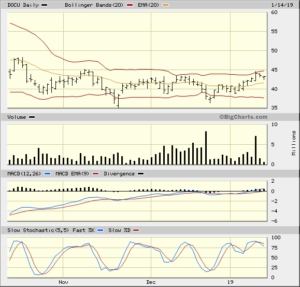
DOCU 3 Month Daily from Bigcharts 2019-01-14

DOCU 3 Month Daily from StockCharts 2019-01-14


2019-01-31

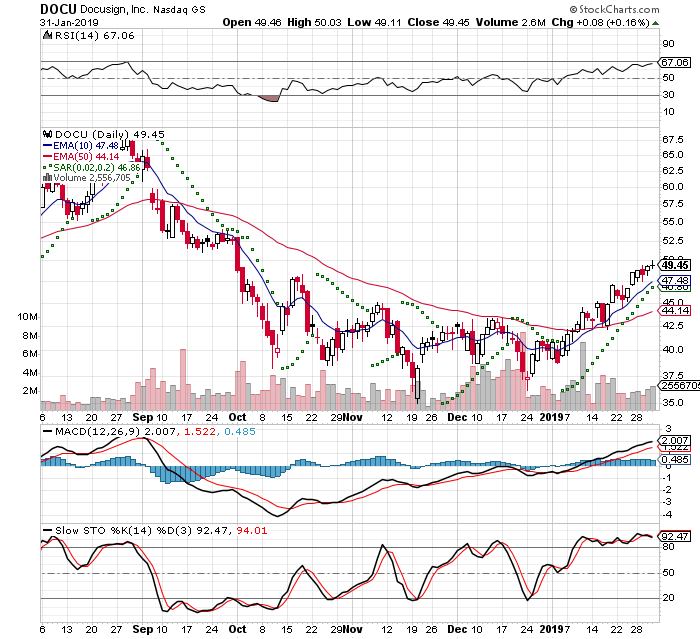
I closed out my position this morning to lock in profits. The uptrend momentum looks like it is drying up and I expect a drop. I will still be watching this for a while. I got filled at $49.98

49.98 Close - 43.44 Bought = +$6.54 / 43.44 = +15% in 19 days

DOCU 3 Month Daily from StockCharts 2019-01-31

Denny’s Corporation – DENN

2019-01-10

This trade idea came to my last year and I had been watching this for a few weeks. This was in Investors Business Daily Stocks on the Move Up in price on 2018-11-18 and I decided to put it on my watch list. It was then featured in IBD Weekly Stock Spotlight VOL 35 NO 38. I was looking for a good time to enter a position.

When screening stocks I'm focusing on stocks in the $20-40 range, because I buy in round lots in order to be able to sell a call against it - Covered Calls

I have been cautious with the current market conditions, but I am still testing the waters. I'm building up my portfolio slowly and I felt this was a good time to enter

I bought on 01/04 and I am at Trading Day 5 with a  Time Stop of 7 days. If I buy a stock and it is not making me money by 7 days - it a sell.

I am setting my targets based on the charts instead of a hard percentage. This is a modification to my Trading Plan

I got filled at $16.66
-5% stop = $15.68
10% Target = $17.50

IBD Rankings 01/10/19
Composite Rating: 97
EPS Rating: 89
RS Rating: 95
Group RS Rating: B+
SMR Rating: N/A
Acc/Dis Rating: B+
ROE: 0%
Debt: 0%
Outstanding Shares: 62.6m
EPS Due Date: 2/11/19

Dr Alexander has a triple screen for viewing charts and Trading for a Living is why I use the following charts

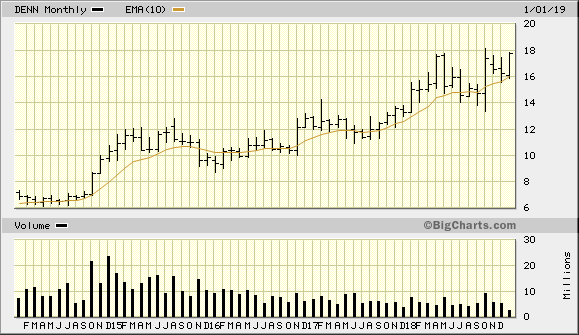
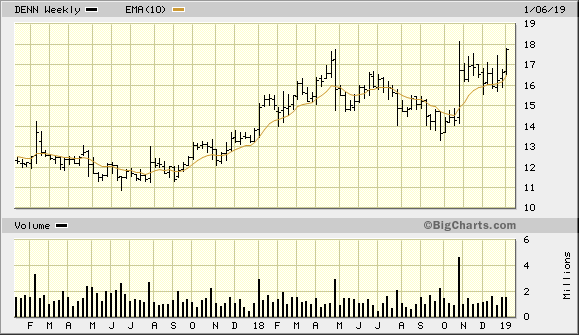
DENN 5 Year Monthly from Bigcharts 2019-01-10
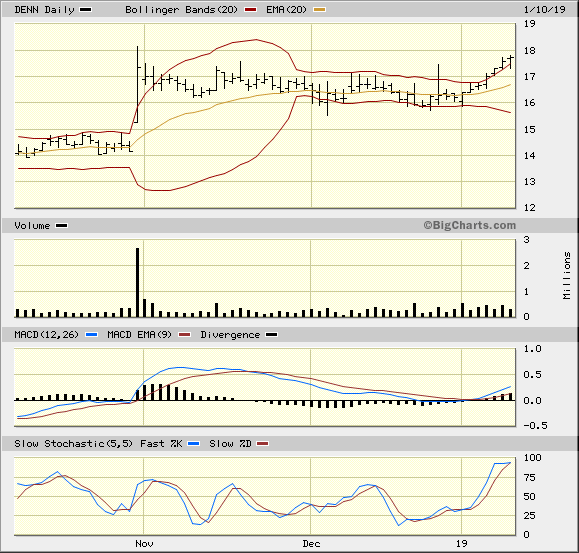
DENN 2 Year Weekly from Bigcharts 2019-01-10
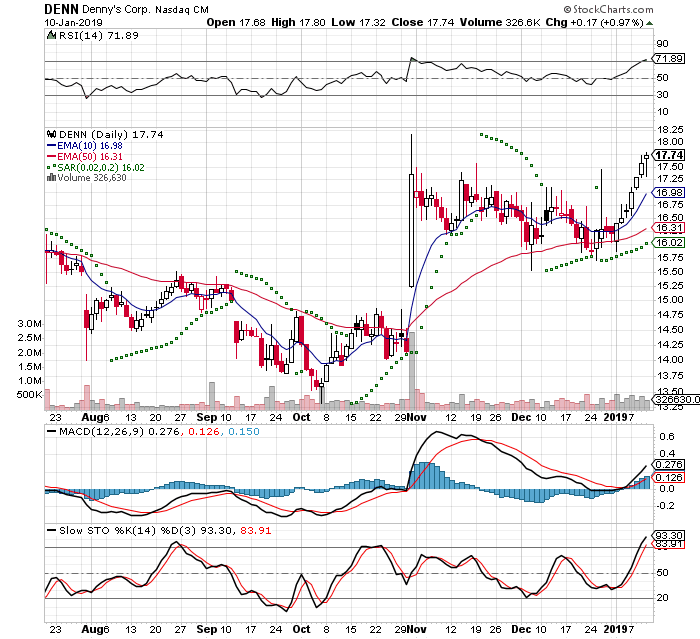
DENN 3 Month Daily from Bigcharts 2019-01-10
DENN 3 Month Daily from StockCharts 2019-01-10

2019-01-27

I closed out the position Friday, because the momentum had been drying up and I wanted to lock in the first gains for this year. I got filled at $17.94

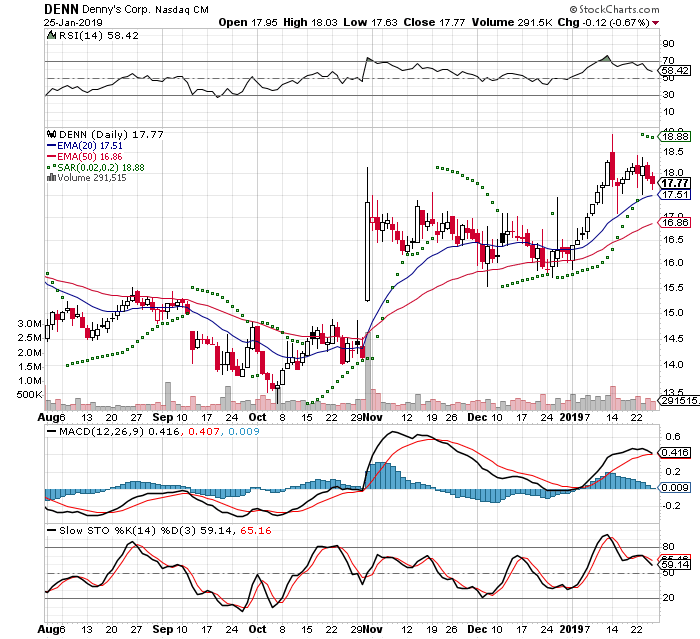
DENN 3 Month Daily from StockCharts 2019-01-27