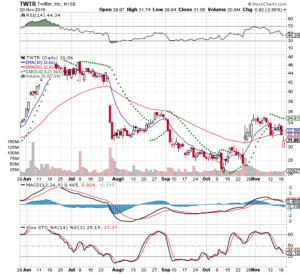
This was in Investor’s Business Daily Stocks on the Move on 2018-20-25 and I bought 100 shars, because they had announced positive earnings. I had closed out VNDA and AMD and wanted to keep the cash active
I got filled at $31.65
-5% stop = $30.06
20% Target = $37.97
Dr Alexander has a triple screen for viewing charts and Trading for a Living is why I use the following charts
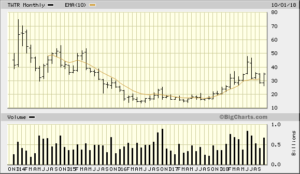
5 year monthly chart from bigcharts
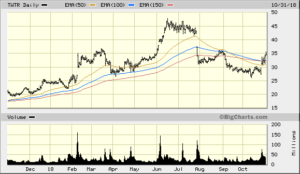
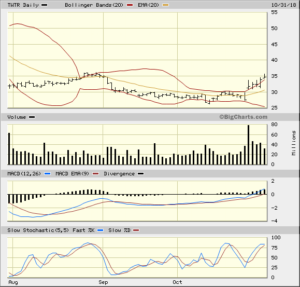
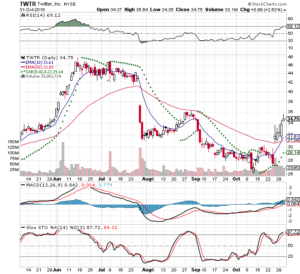
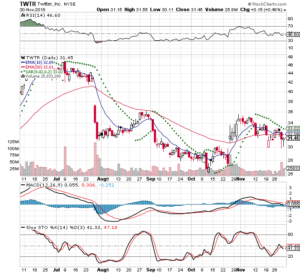
TWTR 5 Year Monthly from Bigcharts 2018-11-01TWTR 1 Year Daily from Bigcharts 2018-11-01TWTR 3 Month Daily from Bigcharts 2018-11-01TWTR 3 Month Daily from Stockcharts 2018-11-01
2018-11-20
I closed out my position today, because the overall market has been negative and TWTR is carried along with this tech crash. I had been up and today all of the gains were gone and I got filled at a -3% loss $30.66
TWTR 3 Month Daily from Stockcharts 2018-11-20
2018-11-29
I took another bite at the apple, because I had seen a large black candle. I thought this was a good time to buy – I was wrong
I bought at the open and was stopped out 1 hour later. I was looking for a bounce off of the 50 Day EMA, but it didn’t and it rolled over
This company came to my attention by reviewing IBD’s Stocks on the move on 10/23/18. This had made a new high and it was under $40. I had room available in my portfolio for that.
I bought the next day within the opening hour. This traded down that day and day after and the day after. I was down 3.5% in 3 days and had considered on just closing out the position, but held till this morning. Today was a good day and made that back.
They have moved into “plant based” products and this is a $3.7 billion market. Zack’s had this industry group at the bottom 1%. So I’m not thinking this is going to shoot to the moon.
IBD Rankings today
Composite Rating: 84
EPS Rating: 76
RS Rating: 94
Group RS Rating: D+
SMR Rating: B
Acc/Dis Rating: C
ROE: 18.1%
Debt: 5%
Outstanding Shares: 533.1m
EPS Due Date: 11/19/18
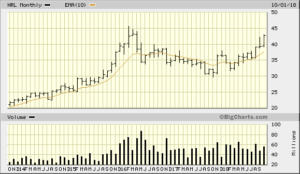
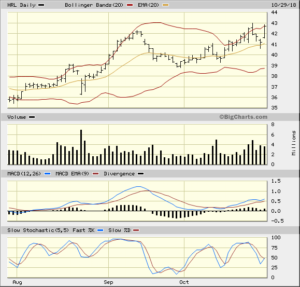
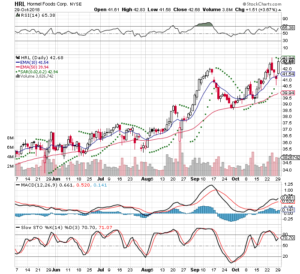
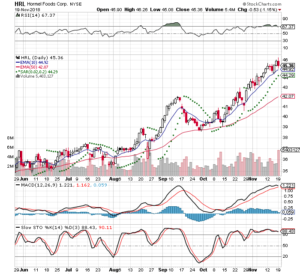
Dr Alexander has a triple screen for viewing charts and Trading for a Living is why I use the following charts
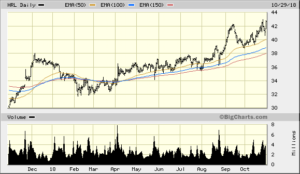
HRL 5 Year Monthly from Bigcharts 2018-10-29HRL 1 Year Dailly from Bigcharts 2018-10-29HRL 3 Month Dailly from Bigcharts 2018-10-29HRL 3 Month Dailly from Stockcharts 2018-10-29
2018-11-20
I closed out my position today, because they are reporting earnings tomorrow. This had been increasing on lighter volume and that told me that a drop is due. See Accumulation/Distribution
I got filled at $45.74 at the open and locked in a gain. This will still be on my watch list for a while either way the earnings announcement goes
This trade idea came to me during my review of Investors Business Daily, IBD Weekly, VOL 35 NO. 29 Week of October 22, 2018. This was featured in the Stock Spotlight section. I had liked the chart pattern and researched a little further
IBD Rankings today
Composite Rating: 95
EPS Rating: 76
RS Rating: 95
Group RS Rating: A
SMR Rating: D
Acc/Dis Rating: B
ROE: 0%
Debt: 0%
Outstanding Shares: 54.2m
EPS Due Date: 11/05/18
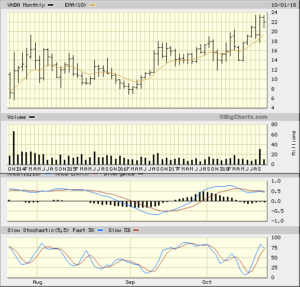
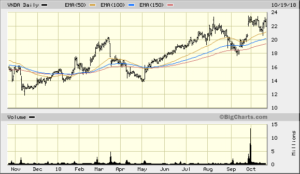
Dr Alexander has a triple screen for viewing charts and Trading for a Living is why I use the following charts
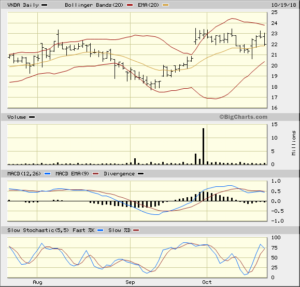
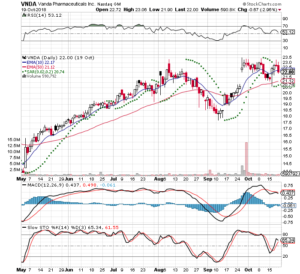
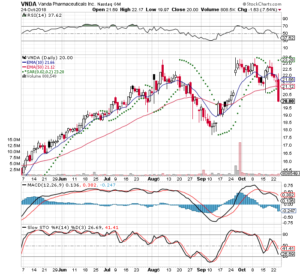
VNDA 5 Year Monthly from Bigcharts 2018-10-22VNDA 1 Year Dailly from Bigcharts 2018-10-22VNDA 3 Month Dailly from Bigcharts 2018-10-22VNDA 3 Month Dailly from Stockcharts 2018-10-22
2018-10-24
I closed out of this position after lunch. The day was not working and I was already down about 1.6%.
I got filled at $20.75 and I am glad I sold when I did, because the rest of the day was worse. It closed at 20.00
This trade idea came from my review of the Investor’s Business Daily – IBD Weekly, VOL 35 N.O. 28 Week of October 15, 2018. This was ranked in IBD50 as #44
This company is a REIT and was considering on investing longer term money one of those. This morning I bought within the first hour of trading. I’m increasing my stop to -8%, because I’m not as concerned about the exact entry
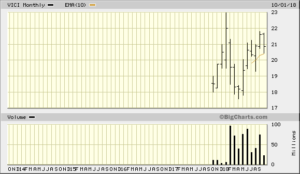
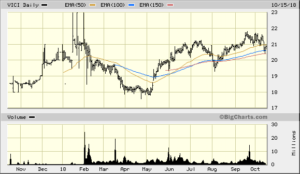
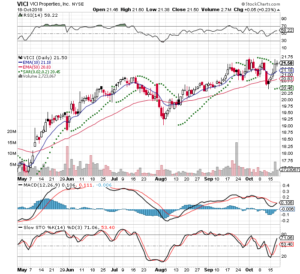
Dr Alexander has a triple screen for viewing charts and Trading for a Living is why I use the following charts
VICI 5 Year Monthly from Bigcharts 2018-10-15
VICI 1 Year Daily from Bigcharts 2018-10-15
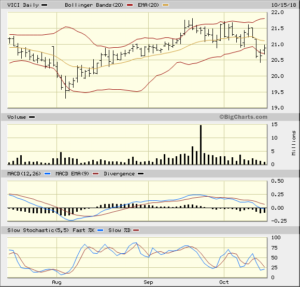
VICI 3 Month Daily from Stockcharts 2018-10-15
2018-10-18
This morning I bought an additional 100 shares, because I liked the way it was trading. There was a good day yesterday on strong volume – about 2.5x’s.
This raised my cost basis, but it is going the direction I wanted it to go and I’m averaging up. Adding to a losing position can destroy an account. I admit I’m wrong and move on
My average position numbers are: Cost: $21.34 -8% stop: $19.36 +20% Target: $25.48
The MACD is still positive and the MACDH is about to cross the zero line
Here is the 3 month chart from Stockcharts
VICI 3 Month Daily from Stockcharts 2018-10-18
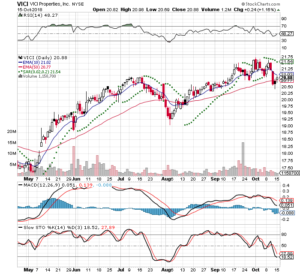
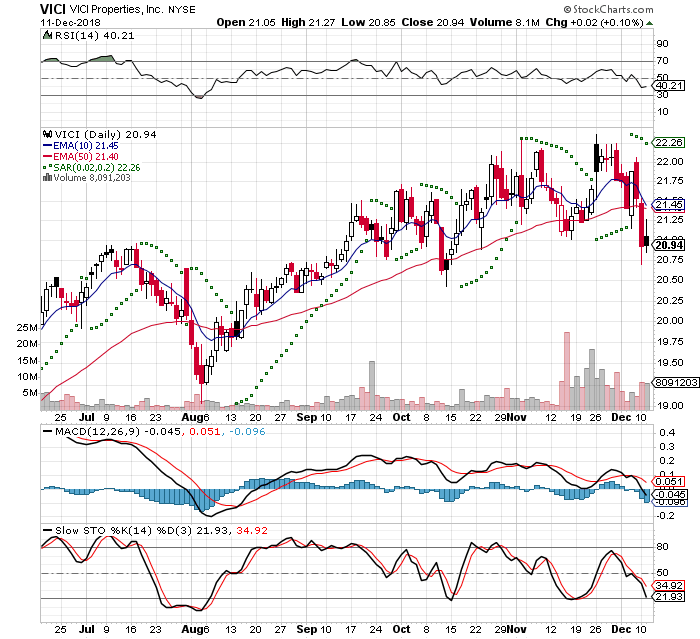
2018-12-11
I closed out the position today $21.22 at a loss of -$.01, because it was not performing correctly. There was an article a couple of days ago about this being a possible short candidate for hedge funds.
Here is the current 3 Month Chart from Stockcharts.com
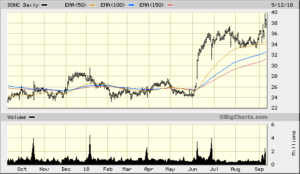
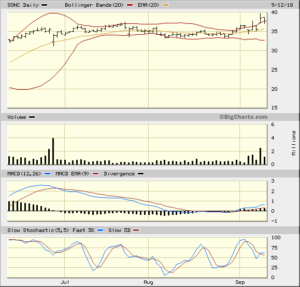
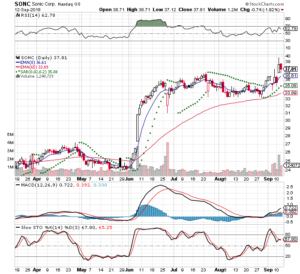
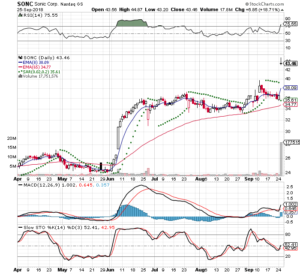
This was in Investor’s Business Daily Stocks on the Move yesterday and I placed a limit order today at yesterday’s close. I have giving myself a time stop of 7 days. If this does not turn positive then I will sell. This is Day 1 and it wasn’t good, but I am still within the stop. Looking at the charts there should be support at 35, but that is below my 5%. We shall see…
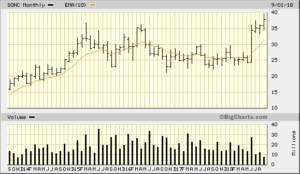
Dr Alexander has a triple screen for viewing charts and Trading for a Living is why I use the following charts
SONC 5 Year Monthly from Bigcharts 2018-09-12
SONC 1 Year Daily from Bigcharts 2018-09-12
SONC 3 Months Daily from Bigcharts 2018-09-12
SONC 3 Months Daily from Stockcharts 2018-09-12
2018-09-25
I sold today, because Sonic was bought out and the upside beyond today is limited. I was down about -6.5%. This is beyond my normal -5% stop, but I wanted to give this one a wider stop.
The way this has been trading I moved it to -8% which is the classic CANSLIM stop loss.
I had been watching this seriously when it was ranked #14 on Investors.com publication ofIBD Weekly IBD 50 Vol 35 N.O. 18 Week of August 6, 2018. This has been featured before, but I work with a small account and was fully positioned at that time . Risk Management rules restrained me at that time
I had sold one position and had cash available to roll into another one. I checked on this one last night and saw that it had sold off…
Then I looked at it’s volume. It was about 1/3 of what it normally trades at. That is a huge signal for reading the tape or Accumulation/Distribution
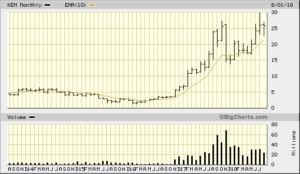
Dr Alexander has a triple screen for viewing charts and Trading for a Living is why I use the following charts+
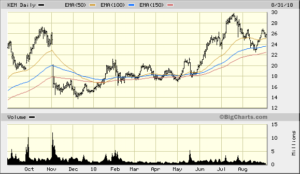
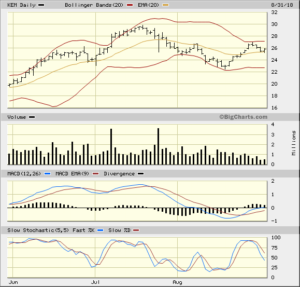
KEM 5 Year Monthly from Bigcharts 2018-08-31
KEM 1 Year Daily from Bigcharts 2018-08-31
KEM 3 Month Daily from Bigcharts 2018-08-31
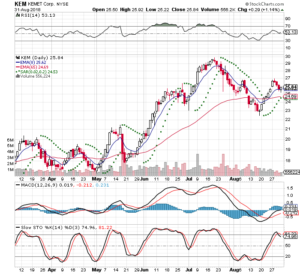
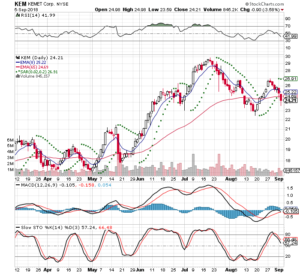
KEM 3 Month Daily from Stockchatrts 2018-08-31
2018-09-05
I sold this one at a loss and I got filled at $23.93. This had a bad day yesterday on average volume and was close to my stop. I held the position, because it didn’t hit the -5% loss limit. I wasn’t overly concerned, because with the average volume people were no running for exit. I watched this one close and it was a down day at the start of the day. I had expected it to bounce and at lunch I checked… It didn’t recover and I closed the position
Opened position at: $25.50
Closed position at: $24.22
$-157 or -6.2%
I started watching this on 2018-06-14 and looking for the right time to open a position. I am buying an Out of The Money $35 call Sept 21, 2018. The current price is $32.62
I am expecting the MACD cross over. I bought 3 $35 calls with September 21, 2018 expiration. At the time that I bought the stock price was at S32.72
I got filled at
-100% stop: -.50
300% Target: 1.50
IBD Rankings today
Composite Rating: 96
EPS Rating: 92
RS Rating: 93
Group RS Rating: A+
SMR Rating: B
Acc/Dis Rating: B
ROE: 18.2%
Debt: 51%
Outstanding Shares: 929m
EPS Due Date: 10/30/18
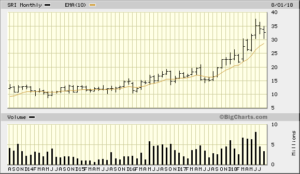
Dr Alexander has a triple screen for viewing charts and Trading for a Living is why I use the following charts
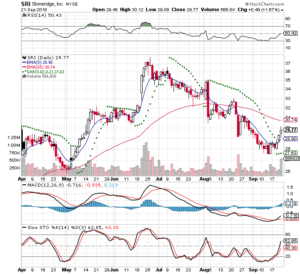
SRI 5 Year Monthly from Bigcharts 2018-08-20
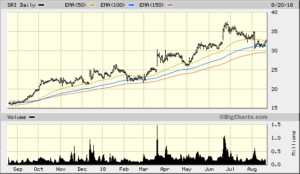
SRI 1 Year Daily from Bigcharts 2018-08-20
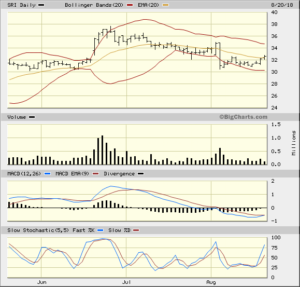
SRI 3 Month Daily from Bigcharts 2018-08-20
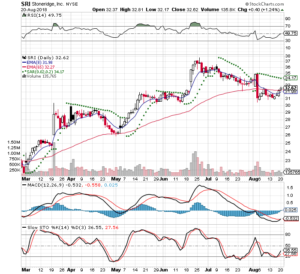
SRI 3 Month Daily from Stockcharts 2018-08-20
2018-09-23
Well this trade idea didn’t work out. I had expected the MACD and MACDH positive crossover. It didn’t happen and I lost the entire position
The PSAR is above and there was a big o’l red candle in August. The stock was already below the 50 EMA and was at the 100 EMA
There was no planned event happening so I had time decay working against me
This is the cost of tuition in learning the market. This was an impulse buy and was not a good setup
This stock idea had come to my attention on 2018-06-2018 when it popped on IBD Stock on the Move. I started watching it and been looking for a good opportunity
Last night I was reviewing the charts and saw a potential MADH positive cross over. The chart look like line of least resistance is on the upside. Tomorrow they are reporting earnings and taking earnings risk by placing a trade this morning
I got filled at 27.90
-5% stop: 26.51
20% Target: 33.45
IBD Rankings today
Composite Rating: 82
EPS Rating: 83
RS Rating: 85
Group RS Rating: B
SMR Rating: C
Acc/Dis Rating: B-
ROE: 18.2%
Debt: 108%
Outstanding Shares: 23.9m
EPS Due Date: 08/09/18
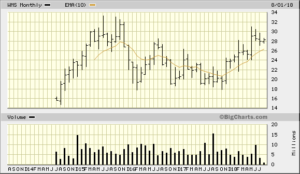
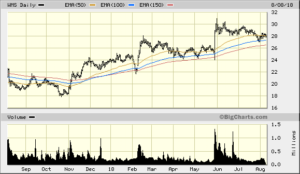
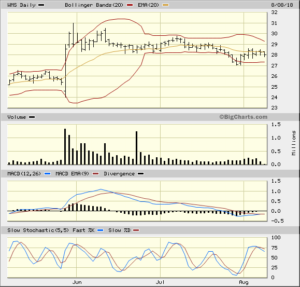
Dr Alexander has a triple screen for viewing charts and Trading for a Living is why I use the following charts
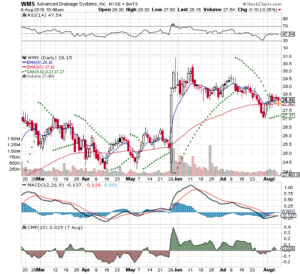
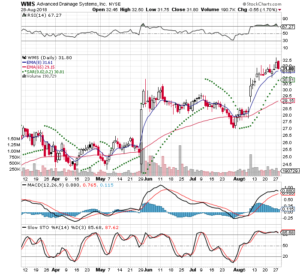
WMS 5 Year Monthly from Bigcharts 2018-08-08
WMS 1 Year Daily from Bigcharts 2018-08-08
WMS 3 Monthly Daily from Bigcharts 2018-08-08
WMS 3 Monthly Daily from Stockcharts 2018-08-08
2018-08-28
I didn’t like the way it was trading and closed out my position this morning. It was slowly increasing on light volume and the momentum was slowing. The MACDH was trending down and oscillators have been overbought for a while. I got filled at $32.31
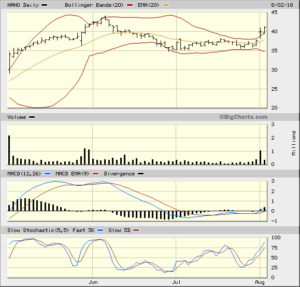
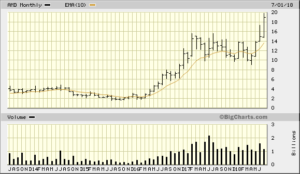
This stock idea came to me from doing my research on Investor’s Business Daily after reviewing my positions yesterday. This was in Stocks On The Move and it piqued my interest.
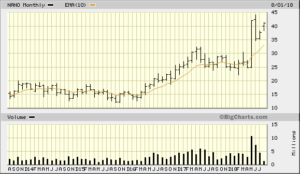
This company had posted earnings and popped. It looked like that the momentum had shifted to the upside and I expect resistance around $45. I placed a Limit Order at yesterday’s close this morning.
I got filled at $39.95
-5% stop = $33.62
20% Target = $42.47
Dr Alexander has a triple screen for viewing charts and Trading for a Living is why I use the following charts
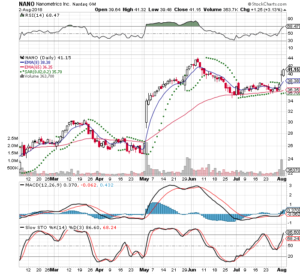
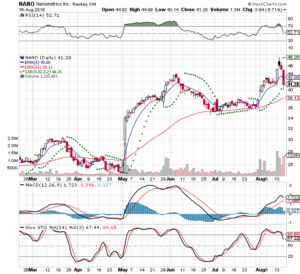
NANO 2018-08-02 5 Year Monthly Bigcharts
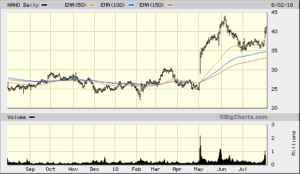
NANO 2018-08-02 1 Year Daily Bigcharts
NANO 2018-08-02 3 Month Daily Bigcharts
NANO 2018-08-02 3 Month Daily Stockcharts
2018-08-16
I had bought ahead of earnings, but liked how the market was setting up. Earnings was announced and pop!
I was sitting on about 12% in about 2 weeks. I reviewed how the stock was trading last night and felt there would be a pull back. I was thinking that 3-4% or even 5% would be normal. I checked a few times in the morning and it was not trading right. So I waited….
Then at lunch time I checked and it was down 10%! I still had a profit and did not like the “volatility”. Swings like that tells me that something is wrong. I sold and locked in a small gain and I got filled at $40.66
This came to my attention on my Thursday review of the IBD Stocks on the Move. I scanned for stocks that were below $40.00. They had reported earnings and bought on Friday for a short term momentum play
I got filled at $19.10
-5% stop = $33.62
20% Target = $42.47
Here are the IBD Rankings on the Friday edition of IBD Weekly VOL. 35, No.16 Week of July 23, 2018
IBD Rankings today
Composite Rating: 98
EPS Rating: 76
RS Rating: 96
Group RS Rating: C
SMR Rating: A
Acc/Dis Rating: A-
ROE: 22%
Debt: 217%
Outstanding Shares: 969.3m
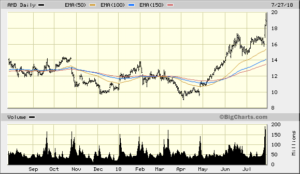
Dr Alexander has a triple screen for viewing charts and Trading for a Living is why I use the following charts
5 year monthly chart from bigcharts
AMD 2018-07-27 5 Year Monthly Bigcharts
1 year daily chart from bigcharts.
AMD 2018-07-27 1 Year Daily Bigcharts
I use a 3 tier 50 day EMA. What I’m looking for is a cross over for the shorter term over the long term. The 50 EMA should be a level for institutional support
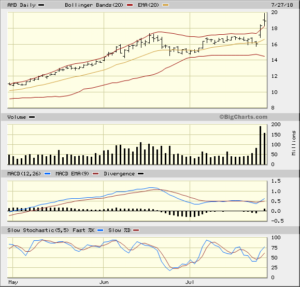
AMD 2018-07-27 3 Month Daily Bigcharts
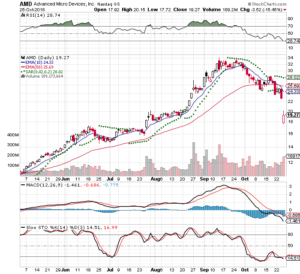
3 Month Daily from StockCharts.com
AMD 2018-07-27 3 Month Daily Stockcharts
2018-09-13
The upside on this trade was really impressive and I credit it to some hard work, having some available cash, and luck. I got filled at $31.20 and locked in a $1,200 gain in about 6 weeks.
I really didn’t a see a day that I really didn’t like until it touched my stop intraday and bounced. Today the trading range wasn’t right and I sold have of my position.
Last night I had discussed this stock with my friends from the local IBD Meetup. They recommended to take half and lock in the profit. Then let the rest ride
So I’m sitting on 100 shares at a very good price point and this could be a good long term play
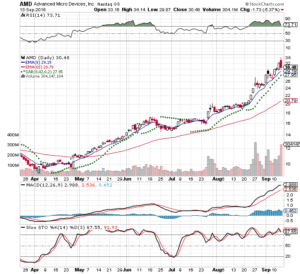
Here is the 3 Month chart from Stockcharts
AMD 3 Months Daily from Stockcharts 2018-09-13
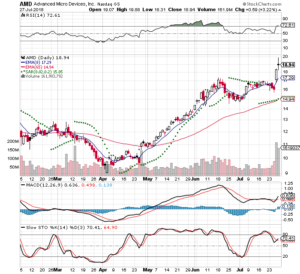
2018-10-25
I closed out the remaining 100 shares today at a slight loss -3.44%. I got filled at $18.44 during the first hour the market opened. This was down from the high and has been steadily selling off.
I was sitting on a 25% profit and then earnings were announced and the market overall had a violent shake. The after hours trading was all the way down at $17.69
Lesson learned. I had at one point a 70% gain and I’m grateful that I sold half of my position there. I had held the remaining looking for a much longer term and it turned into a loss.
I still think that it’s going lower, but I’m not going to be placing any short position against it. The put options are very expensive right now to place a realistic trade