Blog

Enphase Energy Inc – ENPH

Investor Presentation

The Future of Home Energy Management

Enphase Energy, Inc. is a global energy technology company and the world’s leading supplier of solar microinverters. The Company delivers smart, easy-to-use solutions that connect solar generation, storage and management on one intelligent platform. Its semiconductor-based microinverter system converts energy at the individual solar module level and brings a system-based high-technology approach to solar energy generation, storage, control and management.

2019-09-22

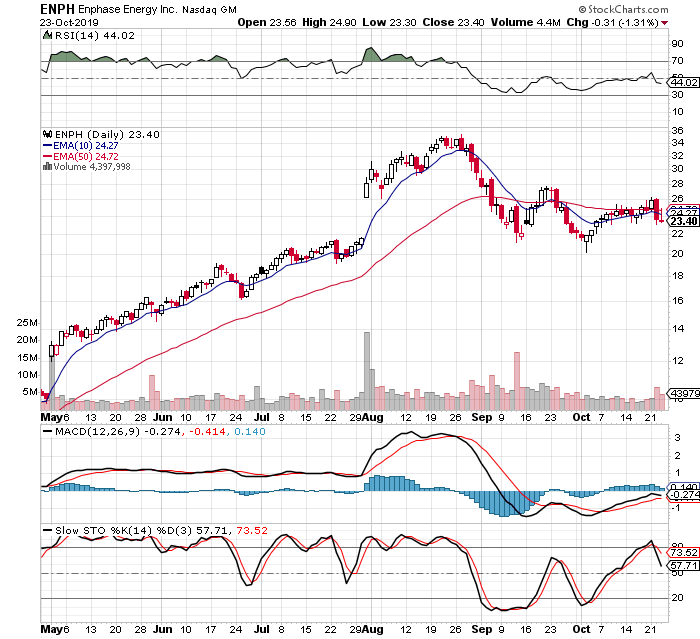
This trade idea came from reviewing Investor's Business Daily Stock on The Move on Thursday 2019-09-19. I liked the chart and decided to buy off of that.

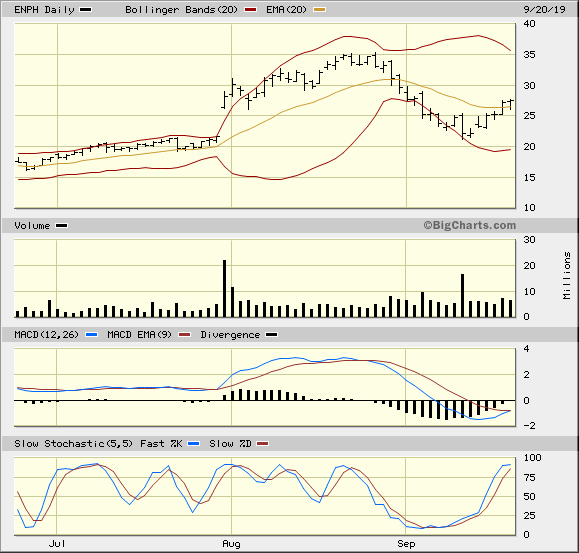
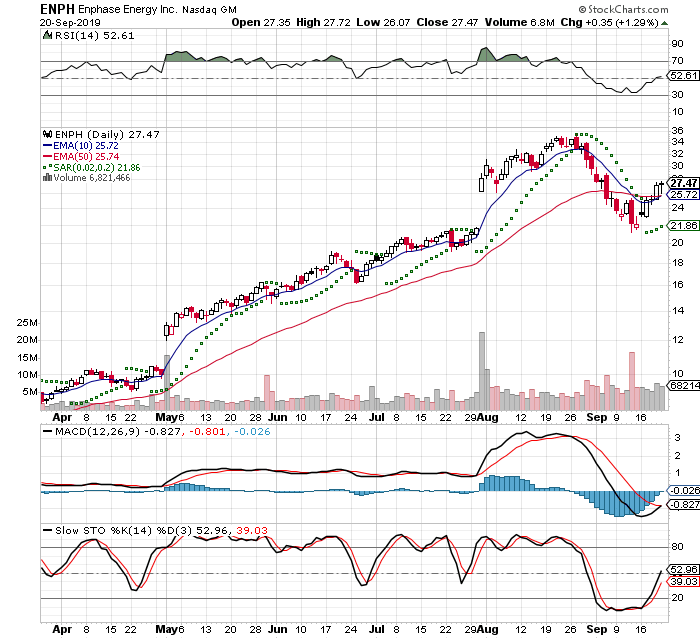
This was a buyable gap up and it closed the gap. In candlestick speak it closed the window and is finding support again.

It passed several of the criteria and I saw the MACD and MACDH were crossing and turning positive. There were several moving averages were also crossing

It opened lower in the first hour of trading. Based on the moving averages I didn't think it would go lower and bought. That turned out to be a great fill

Check out buyable gap up setup: In The Trading Cockpit with the O'Neil Disciples: Strategies that Made Us 18,000% in the Stock Market.

The classic textbook on candlestick charting is Japanese Candlestick Charting Techniques, Second Edition

This is a risky trade please do your own due diligence

I got filled at $26.28

Stop Loss -19% at $21..25
This is a larger than normal range, but this is lowest it should go based on the current bottom. This is the max loss and will trim this if the trading going bad

Upside Target +35% at $35.42
This is the last New High and will meet some resistance at this level. I will hold to see how it trades at this level. I will sell off half of my position at this level

IBD Rankings 09/20/19
Composite Rating: 86
EPS Rating: 77
RS Rating: 99
Group RS Rating: A+
SMR Rating: N/A
Acc/Dis Rating: D
ROE: 12.60%
Debt: 1050% - Heavily Leveraged
Outstanding Shares: 122.0m
Float: 78.1m
EPS Due Date: 11/06/19
PE Ratio 344.84x
Ex-dividend date: None
EPS % Chg (Last Qtr)900%

Zack's has this as a Buy: ENPH

Dr Alexander has a triple screen for viewing charts and Trading for a Living is why I use the following charts
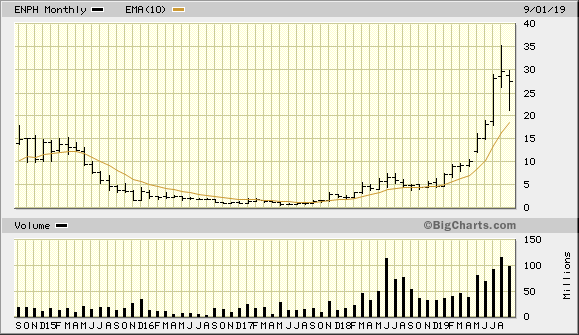
ENPH 5 Year Monthly from BigCharts 2019-09-20
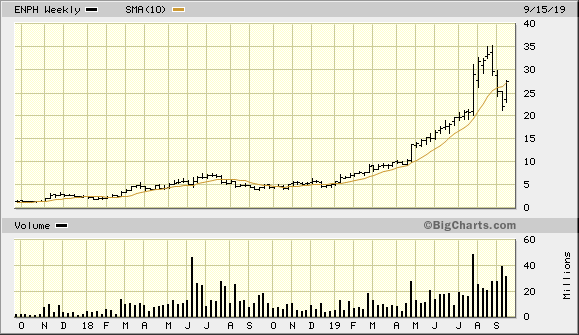
ENPH 2 Year Weekly from BigCharts 2019-09-20
ENPH 3 Month Daily from BigCharts 2019-09-20
ENPH 3 Month Daily from StockCharts 2019-09-20

2019-10-23

I closed out of my position today, because I see the market continuing to be against me. Yesterday was a very bad day and the way I'm reading the tape is this is an active short. I normally play the long side, because it is psychologically fitting for me

There was a double bottom and I had been expecting things to turn for the better. The stock was at a convergence point with a collapsing trading range and a tightening of moving averages

I got filled at $24.17

$26.28 - $24.17 = -$2.11 / $26.28 = -8%

ENPH 3 Month Daily from StockCharts 2019-10-23

OneMain Holdings Inc – OMF

Yahoo Finance Profile Description
OneMain Holdings, Inc., through its subsidiaries, provides consumer finance and insurance products and services. The company operates in two segments, Consumer and Insurance, and Acquisitions and Servicing. It provides secured and unsecured personal loans; credit insurance products, such as life, disability, and involuntary unemployment insurance products; non-credit insurance; and auto membership plans, as well as retail sales finance services. The company also services and holds real estate loans secured by first or second mortgages on residential real estate. As of December 31, 2018, it operated through a network of approximately 1,600 branches in 44 states in the United States, as well as through omf.com Website. The company was formerly known as Springleaf Holdings, Inc. and changed its name to OneMain Holdings, Inc. in November 2015. OneMain Holdings, Inc. was founded in 1920 and is based in Evansville, Indiana.


2019-08-20

This trade idea came to my yesterday while reviewing Investor's Business Daily Stocks on the Move and today was a follow through day

I have had some loses this month and has wiped out my gains for the year. So that being said I am hesitant in jumping back in with the current market condition. The overall market has been down for most of the month and I am currently only in Boston Scientific.

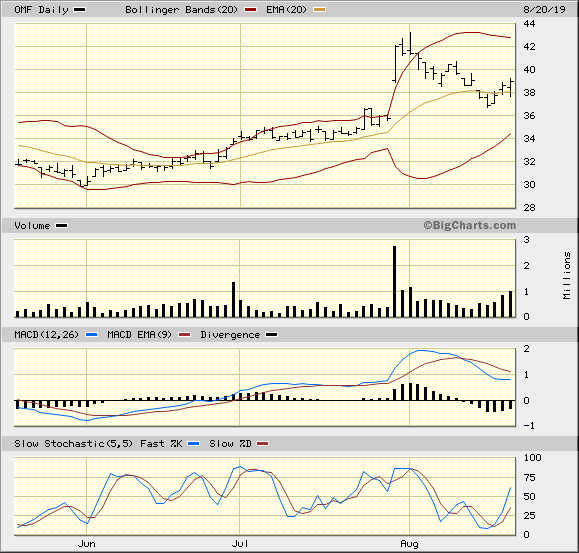
This stock has had a buy gap up and in candlestick lingo the window has been closed. It is now finding buyers again

Check out the setup: In The Trading Cockpit with the O'Neil Disciples: Strategies that Made Us 18,000% in the Stock Market

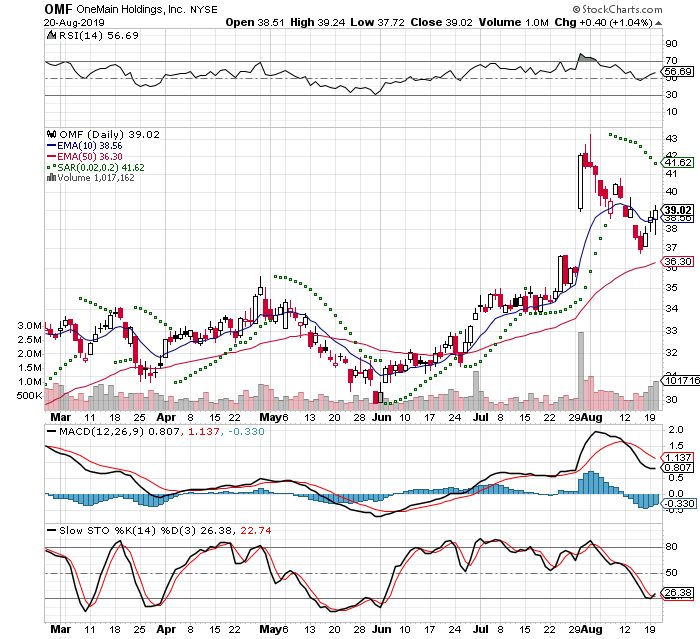
I am placing a market order tomorrow to guarantee fulfillment. The current stock price is $39.02.

2019-08-21
I got filled at $39.43 this morning

Stop Loss -8% at $35.94
This stop is -$3.09 and this is a wider stop than I normally use. The stop is based on the chart where that level is -2% from the consolidation before the gap at $36.67

Upside Target +20% at $46.83
This will hit some resistance at $43 as it approaches the previous high. That would be about a 10% gain, but I suspect that it would go higher because of the recent trading. After it hits 43 I expect a 6 - 8 week pause forming a cup and handle pattern

IBD Rankings 08/20/19
Composite Rating: 90
EPS Rating: 70 - Caution
RS Rating: 91
Group RS Rating: B1
SMR Rating: B
Acc/Dis Rating: B
ROE: 12.6%
Debt: 400% - Heavily Leveraged
Outstanding Shares: 136.1m
Float: 130.6m
EPS Due Date: 10/29/19

From TD Ameritrade Quote Summary 08/20/19
P/E Ratio: 8
Ex-dividend date: 08/26/19

Zack's has this as a Strong Buy: OMF

Dr Alexander has a triple screen for viewing charts and Trading for a Living is why I use the following charts
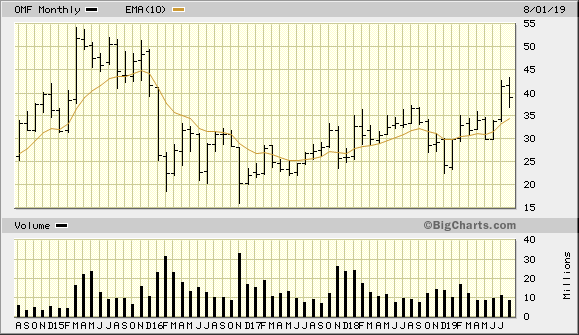
OMF 5 Year Monthly from BigCharts 2019-08-20
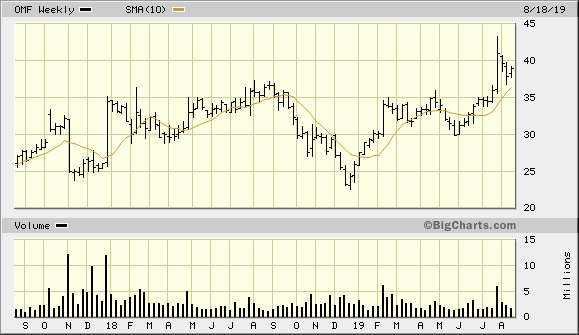
OMF 2 Year Weekly from BigCharts 2019-08-20
BSX 3 Month Daily from BigCharts 2019-07-07
OMF 3 Month Daily from StockCharts 2019-08-20

2019-10-08

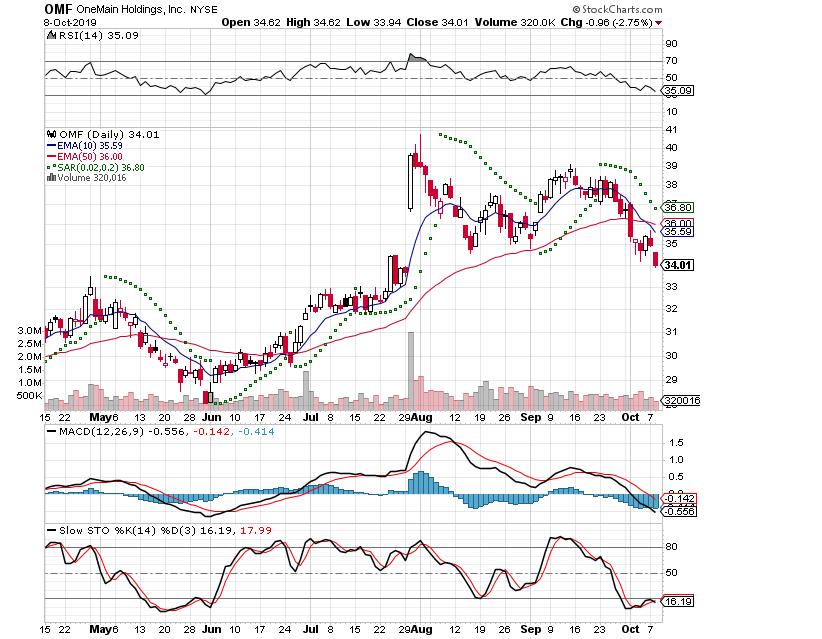
I closed out the position today and I was very wrong. It move against me and put me underwater. I had been on vacation and had not watched as closely as I should have. I did capture the dividend which was a reason to hold on this

I widened my stop a little lower based on the chart. It has broken lower and I threw in the towel

I got filled at $34.24

$39.49 + 2.25 dividend - 34.24 = -$3 / $37.24 = -8%

OMF 3 Month Daily from StockCharts 2019-09-20

2019-10-14

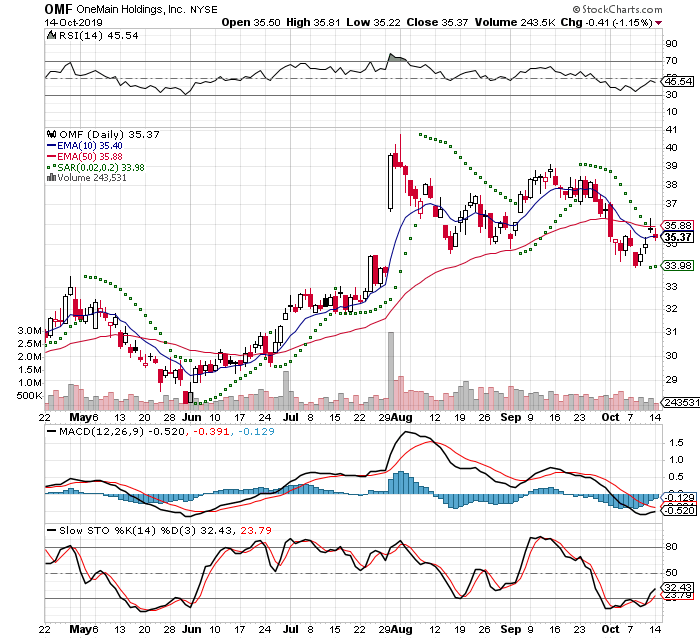
I bought 2 out of the money $36 call options with an expiration of Nov 15, 2019 as an earnings play. They announce October 28, 2019 after the close

I got filled at 1.55 and will be selling at or before the earnings announcement

OMF 3 Month Daily from StockCharts 2019-10-14

2019-10-29

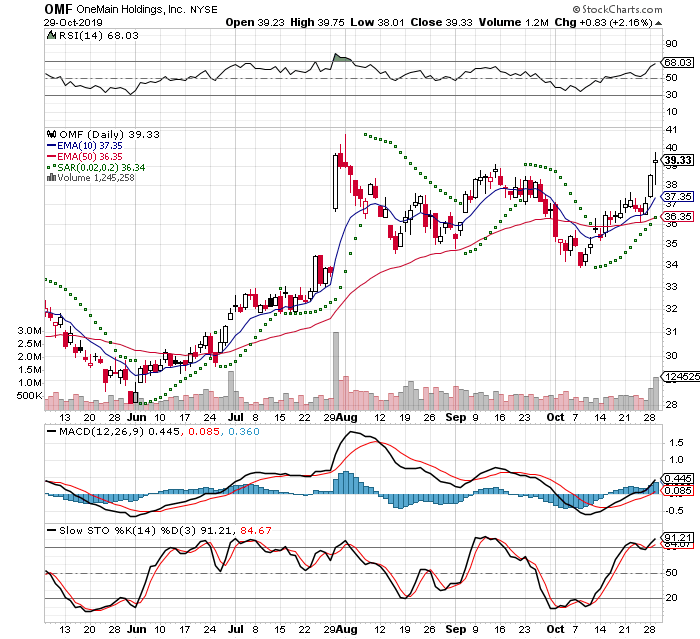
The company reported earnings yesterday and I closed out of my position. I feel that I have regained positive position overall for this company and have captured a large portion of the upside

I got filled at $3.69

$3.69 - $1.55 = $2.14 / $1.55 = +138% in 15 days

OMF 3 Month Daily from StockCharts 2019-10-29

Caredx Inc – CDNA

CareDx

Who We Are

CareDx, Inc., headquartered in Brisbane, California, is a molecular diagnostics company focused on the discovery, development and commercialization of clinically differentiated, high-value diagnostic solutions for transplant recipients. CareDx offers products across the transplant testing continuum, including AlloMap® and AlloSure® for post-transplant surveillance and QTYPE®, TruSight® HLA, Olerup SSP® and Olerup SBT® for pre-transplant HLA testing.

2019-07-11

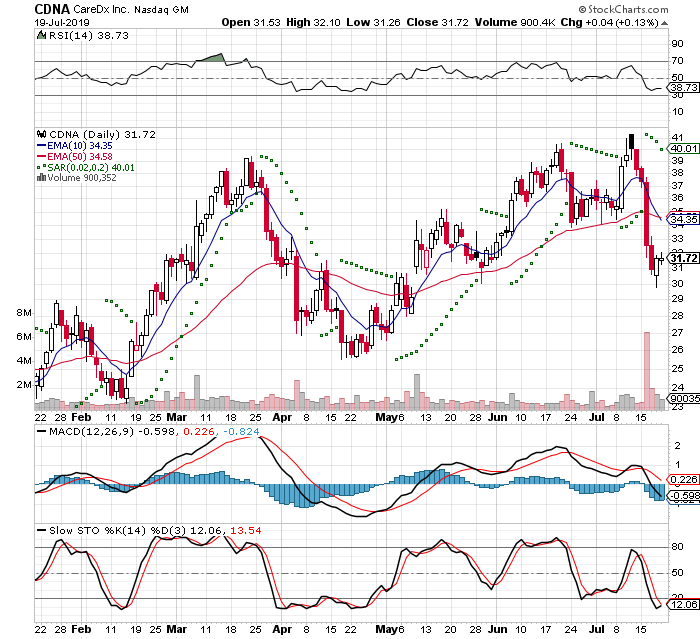
This trade idea came to me from investors.com Stocks on the Move on Wednesday 07/09. I liked the chart and placed the trade the following morning

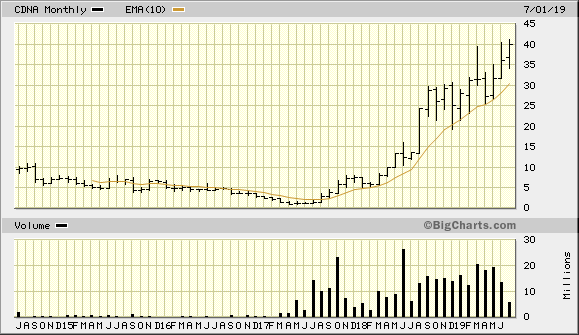
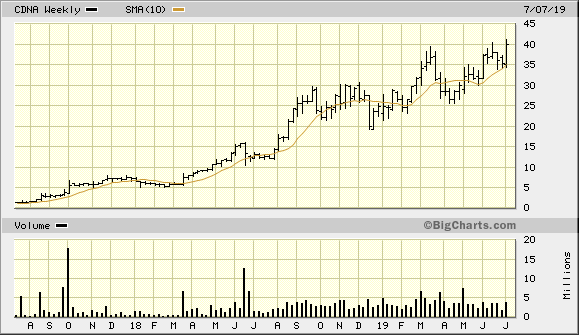
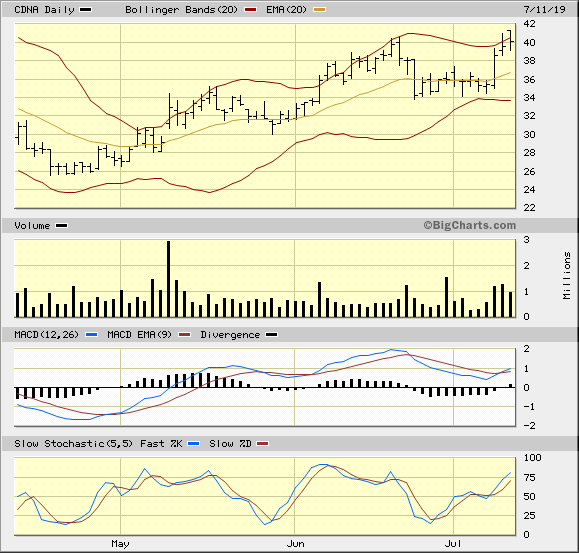
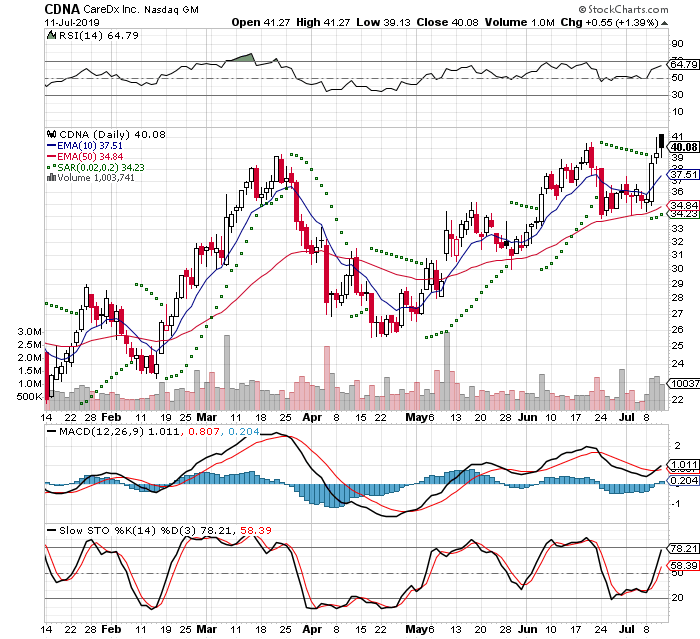
The trade setup is a break out of a 5 month base and selling at the close of a 20 Day EMA. Today is Day 2 of a 7 Trading Day Time Stop

My cost basis: $39.39
-5% Stop: $37.36
+20% Gain: $47.19

IBD Rankings 07/11/19
Composite Rating: 96
EPS Rating: 76
RS Rating: 98
Group RS Rating: A
SMR Rating: D
Acc/Dis Rating: B+
ROE: 0%
Debt: 0%
Outstanding Shares: 42.1m
Float: 40.4m
EPS Due Date: 8/09/19

Trading for a Living: Psychology, Trading Tactics, Money Management
Dr Alexander has a triple screen for viewing charts and Trading for a Living is why I use the following charts
CDNA 5 Year Monthly BigCharts 2019-07-11
CDNA 2 Year Weekly from BigCharts 2019-07-11
CDNA 3 Month Daily from BigCharts 2019-07-11
CDNA 3 Month Daily from StockCharts 2019-07-11

2019-07-20

I closed out of this position on Tuesday 07/16, because it hit my -5% stop on Monday's close. This opened down another 5% at the opening. I had thought it might bounce and it didn't it headed lower.
I checked the news and the main product failed a test. In fact it would cause harm using as intended. There are lawsuits filed for false representations. I could not sell fast enough

I normally avoid the medical field, because of this volatility. I was unfamiliar with the company and relied on the market action to enter the trade. Expensive tuition and lesson learned

I got filled at 33.45

39.39 - 33.45 = -5.94 / 39.39 = -15%

CDNA 3 Month Daily from StockCharts 2019-07-20

Boston Scientific Corp – BSX

2019-07-07

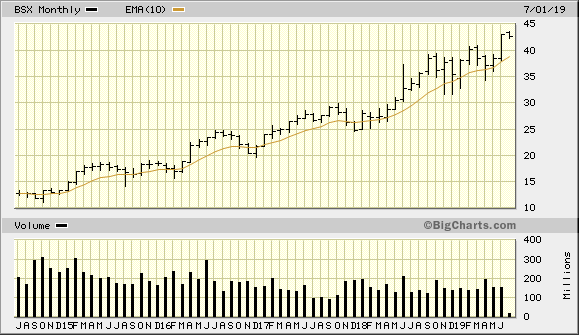
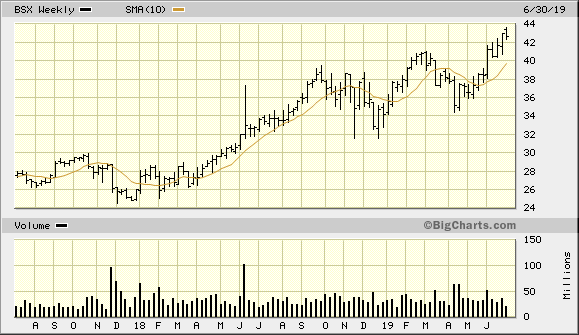
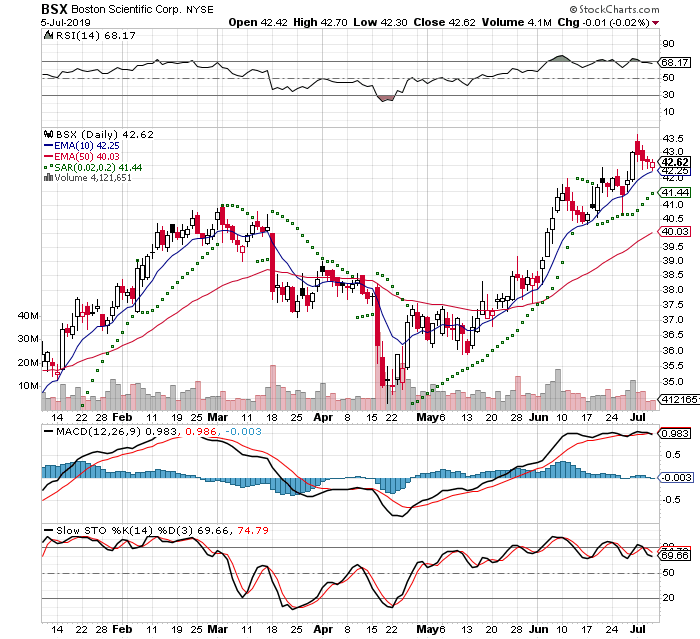
This trade idea came to me a while ago. I had bought this and was one day from my 7 Day Time Stop. It was on Day 5 the indicators I use looked like it was going to turn downward. I was already down I sold.

I first traded it on 2019-06-20 I placed the order late in the afternoon. On that trade
My cost basis: $41.86
-5% stop: $39.78
+20% Gain: $50.24

I kept that on my watch list and then I bought back in on 2019-07-01. This is a risky position, because earnings is 2 weeks away

My cost basis: $
-5% Stop: $
+20% Gain: $

IBD Rankings 07/07/19
Composite Rating: 96
EPS Rating: 85
RS Rating: 87
Group RS Rating: A-
SMR Rating: A
Acc/Dis Rating: A+
ROE: 26.2%
Debt: 55%
Outstanding Shares: 1390.7m
Float: 1376.7m
EPS Due Date: 07/24/19

Trading for a Living: Psychology, Trading Tactics, Money Management
Dr Alexander has a triple screen for viewing charts and Trading for a Living is why I use the following charts

BSX 5 Year Monthly from BigCharts 2019-07-07
BSX 2 Year Weekly from BigCharts 2019-07-07
BSX 3 Month Daily from BigCharts 2019-07-07
BSX 3 Month Daily from StockCharts 2019-07-07

JD.Com Inc Cl A Ads – JD

JD.com is China’s largest online retailer and its biggest overall retailer. It offers customers the best online shopping experience. The company is a member of the Fortune Global 500.

2016-06-30

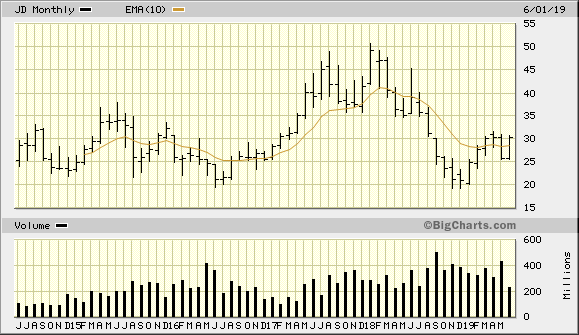
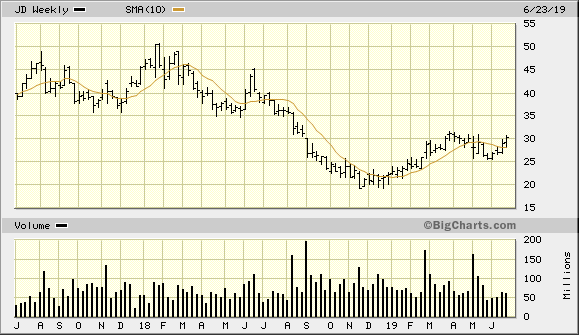
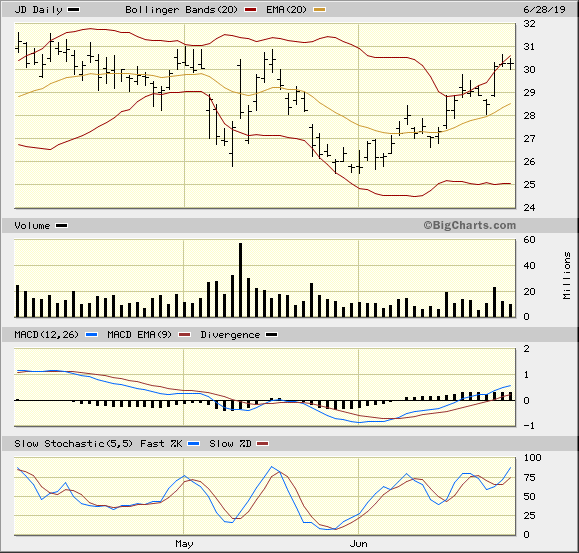
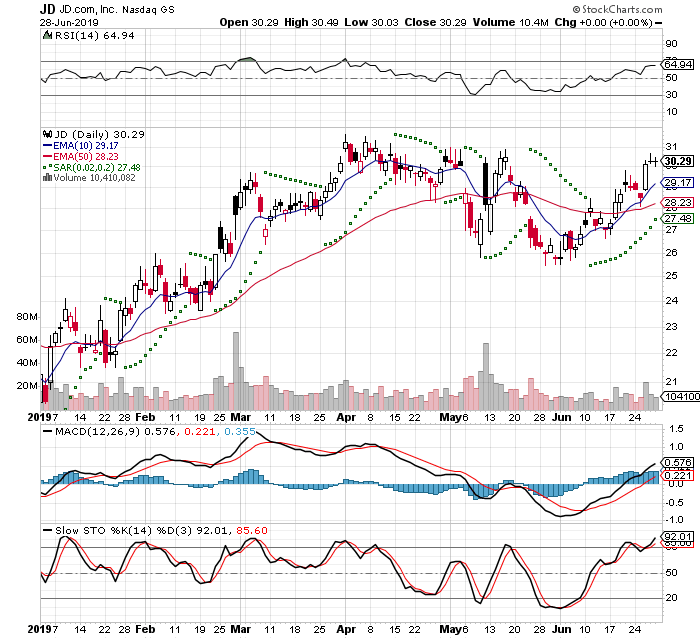
This trade idea came to me by reviewing Investors.com on 2019-06-26 Stocks on the Move. This is a Chinese on line retailer and I am hesitant in purchasing, because of the on going trade war with US and China. I went ahead and did purchase the following day in the afternoon

My cost basis: $30.47
-5% Stop: $28.88
+20% Gain: $36.48

IBD Rankings 06/30/19
Composite Rating: 88
EPS Rating: 75
RS Rating: 72
Group RS Rating: A-
SMR Rating: C
Acc/Dis Rating: A-
ROE: 6.2%
Debt: 17%
Outstanding Shares: 1447.5m
Float: 1158.0m
EPS Due Date: 8/14/19

Dr Alexander has a triple screen for viewing charts and Trading for a Living is why I use the following charts

JD 5 Year Monthly from BigCharts 2019-06-30
JD 2 Year Weekly from BigCharts 2019-06-30
JD 3 Month Daily from BigCharts 2019-06-30
JD 3 Month Daily from StockCharts 2019-06-30

2019-08-12

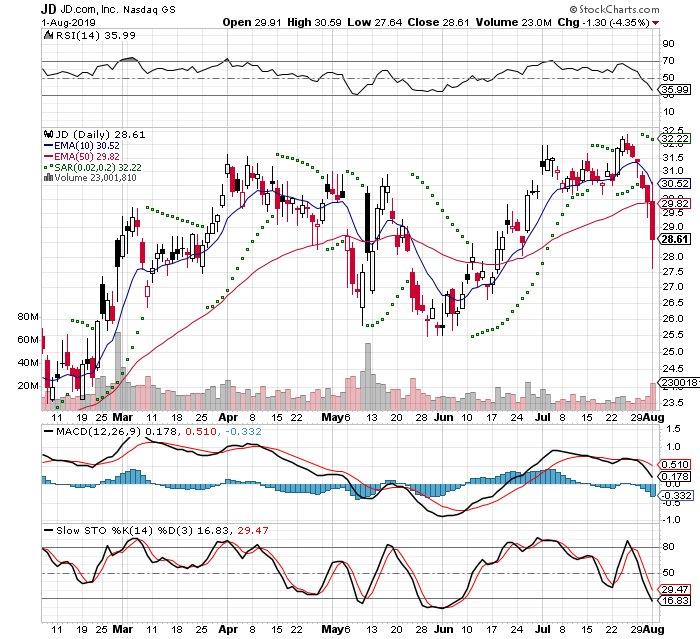
I had closed out this position on 2019-08-01 at a larger loss than my stop. I was up about 3%, but then the day before I was at about break even. Then the morning the stock bounced up and after lunch it crashed.

I got filled at 27.74

30.40 - 27.74 = -$2.66 / 30.40 = -8.75%

This loss caused me to reduce my overall exposure to the market and reevaluate my use of metal stops. I then took a break from the market to adjust my approach and scale back in to the market more cautiously

JD 3 Month Daily from StockCharts 2019-08-01

Air Lease Corp Cl A – AL

Air Lease Corporation is a leading aircraft leasing company principally engaged in purchasing commercial aircraft and leasing them to its valued airline customers worldwide.

2019-06-30

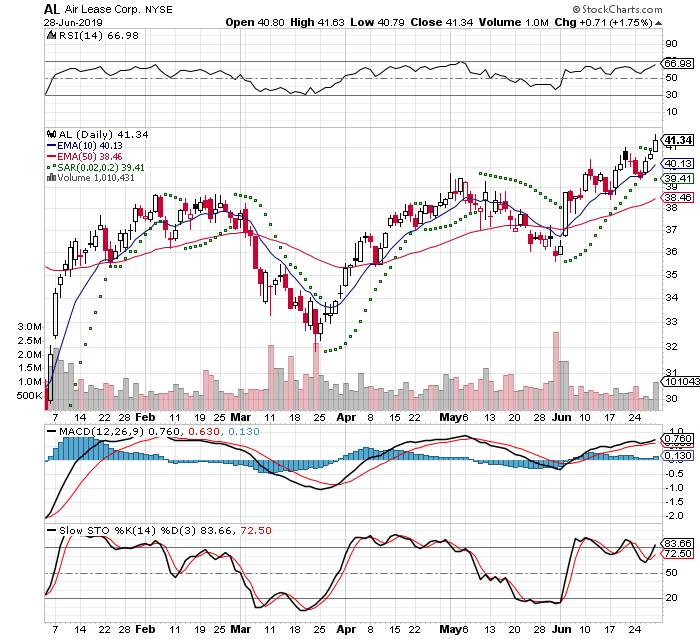
This trade idea came to me from my weekly review of: Investors.com IBD Weekly Vol 36 NO 11 Week of June 24, 2019. It was featured in the IBD50 #41 and I bought the following Monday Today is Day 5 of a 7 Trading Day Time Stop

My cost basis: $40.42
-5% Stop: $38.35
+20% Gain: $48.43

IBD Rankings 06/30/19
Composite Rating: 93
EPS Rating: 93
RS Rating: 84
Group RS Rating: B
SMR Rating: A
Acc/Dis Rating: A
ROE: 11.4%
Debt: 240%
Outstanding Shares: 111.1m
Float: 101.1m
EPS Due Date: 8/07/19

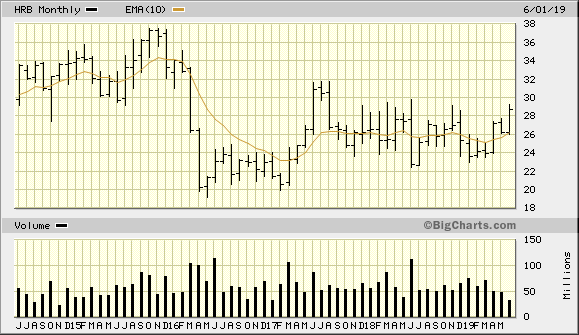
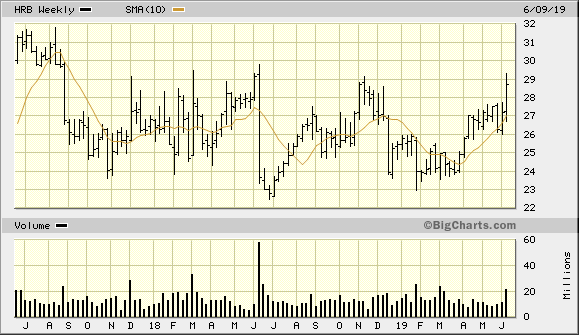
Dr Alexander has a triple screen for viewing charts and Trading for a Living is why I use the following charts

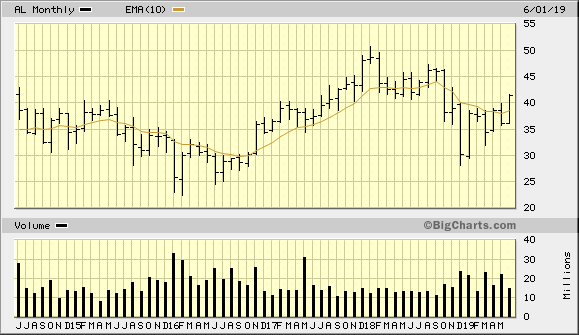
AL 5 Year Monthly from BigCharts 2019-06-30
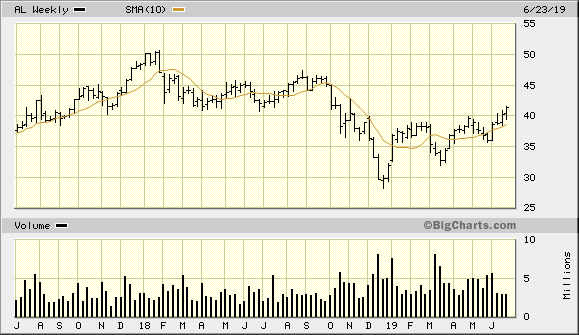
AL 2 Year Weekly from BigCharts 2019-06-30
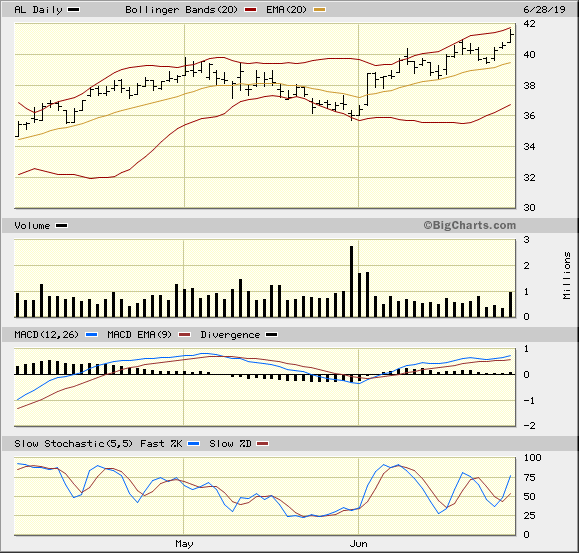
AL 3 Month Daily from BigCharts 2019-06-30
AL 3 Month Daily from StockCharts 2019-06-30

2019-07-20

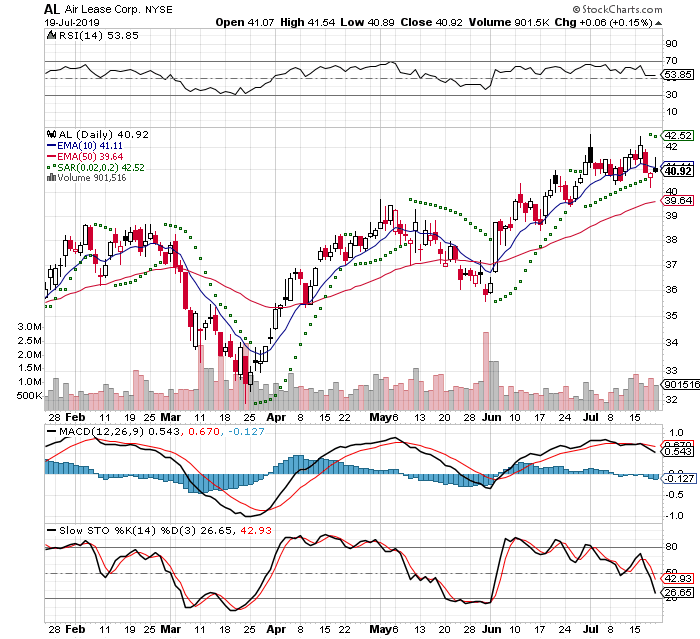
I closed out this position on Friday. I wanted to lighten up my portfolio and I feel that the momentum is slowing. I wanted to lock in a profit

I got filled at 41.13

41-13 - 40.42  = + .71 / 40.42 = +1.8 %

AL 3 Month Daily from StockCharts 2019-07-20

H & R Block Inc – HRB

At H&R Block, we provide help and inspire confidence in our clients and communities everywhere. We’ve been true to this purpose since the beginning when brothers Henry and Richard Bloch founded the company in 1955. In that time, we’ve prepared more than 800 million tax returns. And we’ve grown to have company-owned and franchise retail locations in all 50 states, Puerto Rico and other U.S. territories, on U.S. military bases internationally and around the world.

https://www.hrblock.com/corporate/our-company/

2019-06-16

This trade idea came to me by running a scan from TD Ameritrade on Wednesday. This company interred me and I set a buy order the next day

I set the scan to:
Revenue Growth: +25% - >100%
Current Price: $20 - $50
EPS Growth: 15% - >100%
Volume: >100,000sh
MACD Histogram: Negative to Positive
Price/Sales: 2, 2-3

I bought on Thursday 2019-06-05 in the afternoon, because I expected a dip. The stock had gone up 4 straight days and the MACDH had changed to positive. I am currently down a small percentage and looking to exit quick if it starts to move against me.

This Day 2 of a 7 Trading Day Time Stop. The IBD Rankings are below the CANSLIM standard
IBD Rankings 06/19/19
Composite Rating: 82
EPS Rating: 49
RS Rating: 90
Group RS Rating: A
SMR Rating: C
Acc/Dis Rating: C+
ROE: 95.32
Debt: 380%
Outstanding Shares: 203.3m
Float: 201.3m
EPS Due Date: 8/26/19

I got filled at $28.28
-5% Stop: $26.87
20% Target = $33.94

Dr Alexander has a triple screen for viewing charts and Trading for a Living is why I use the following charts

HRB 5 Year Monthly from BigCharts 2019-06-16
HRB 2 Year Weekly from BigCharts 2019-06-16
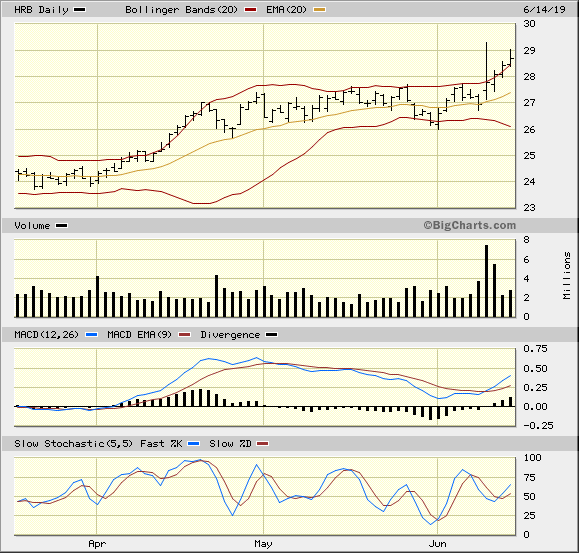
HRB 3 Month Daily from BigCharts 2019-06-16
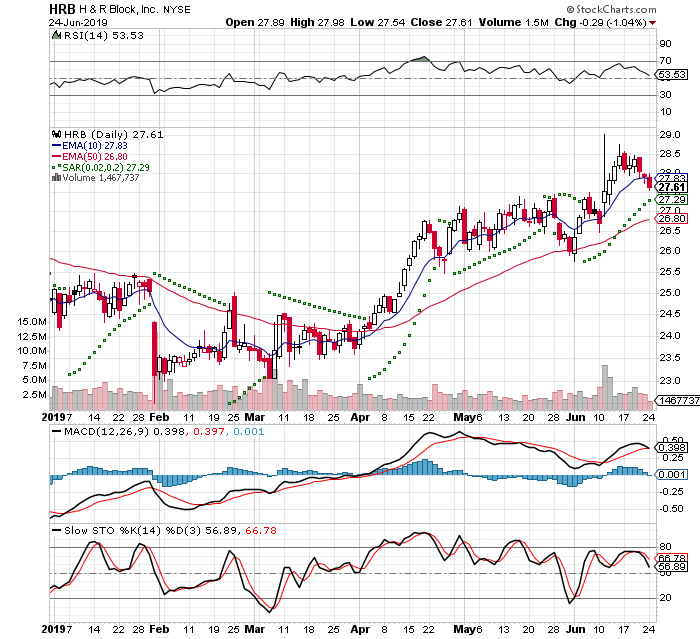
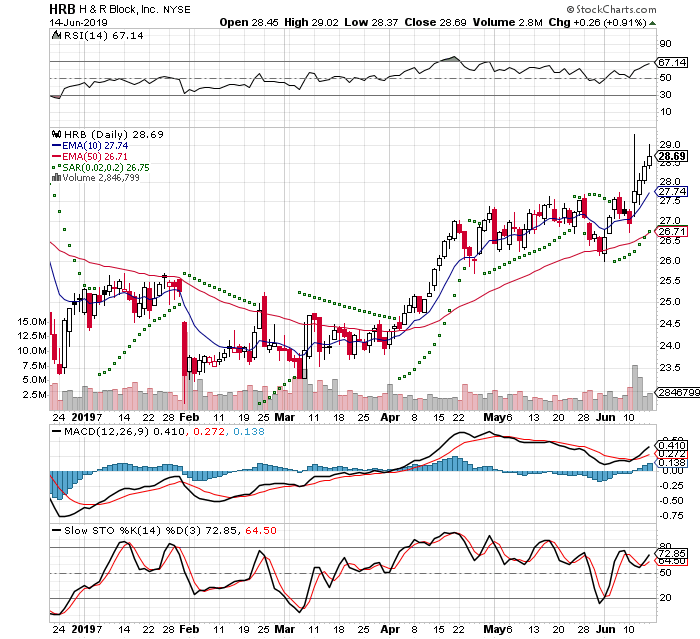
HRB 3 Month Daily from StockCharts 2019-06-16

2019-06-24

I closed out the position today and got filled at $27.80. I had bought this on the MACDH positive cross over and that is about to cross back to negative. Also this had hit my 7 Trading Days Time Stop. Time to move on, but this is still on my watch list

28.28 -27.80 = -.48 / 28.28 = -1.7%

HRB 3 Month Daily from StockCharts 2019-06-24

American Airlines Group – AAL

From the About Overview

Overview
Together with regional partner American Eagle, we offer an average of nearly 6,700 flights daily to 350 destinations in 50 countries. We’re a founding member of the oneworld® alliance, whose members and members-elect offer nearly 14,250 flights daily to 1,000 destinations in 150 countries.

In 2016, American Airlines Group Inc. topped Fortune magazine’s list of best business turnarounds and its stock (NASDAQ: AAL) joined the S&P 500 index.

Connect with American on Twitter @AmericanAir and at Facebook.com/AmericanAirlines.

2019-06-09

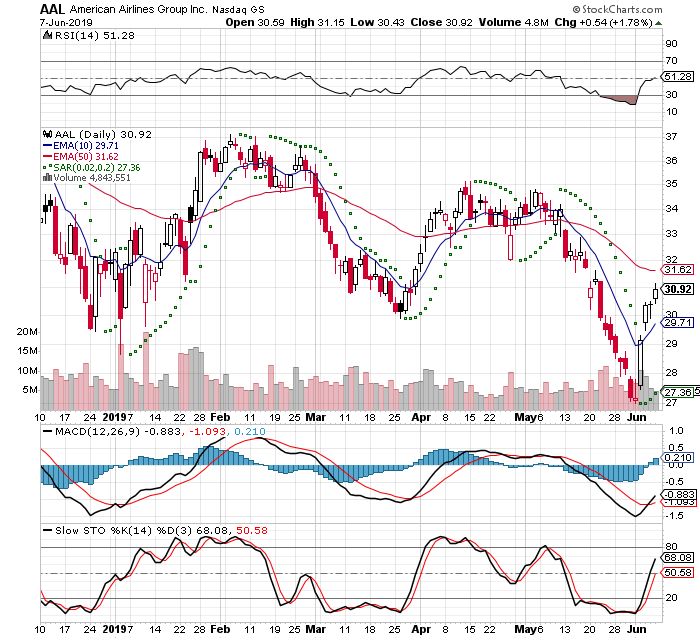
This trade idea came to me om Wednesday 2019-06-06 from a friend of mine that trades options. The setup is a bounce from an oversold position and sell at the 50 day SMA. I placed a limit order for the $30 June 17, 2019 call option for $1.19

I got filled at $1.19 and have 8 days till expiration. The stock has moved in my direction, but time is short

AAL 3 Month Daily from StockCharts 2019-06-09

2019-06-13

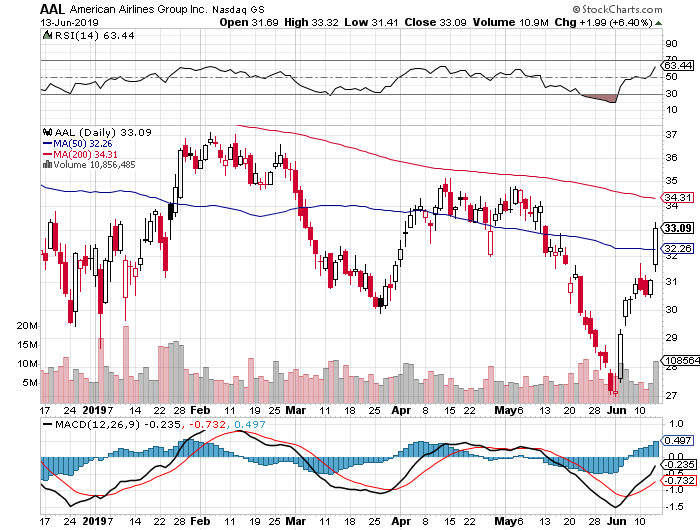
I closed out the position today, because I did not want to be assigned the stock. I ended up selling into a great day for the stock. It had traded up on light volume yesterday and I had till Friday till expiration

I got filled at $2.56 and doubled my money in 1 week

AAL 3 Month Daily from StockCharts 2019-06-13

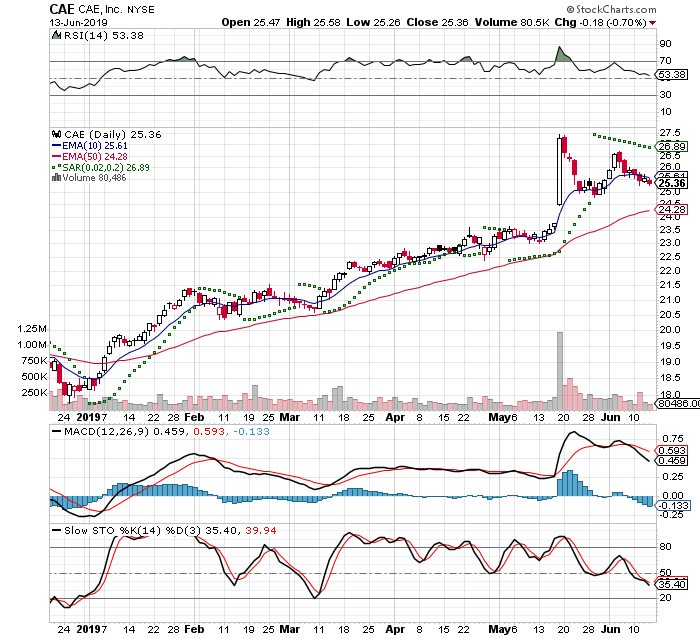
C A E Inc – CAE

From CAE About page
CAE is a worldwide leader in training for the civil aviation, defence and security, and healthcare markets.

2019-06-09

This trade idea came to me by running a scan from TD Ameritrade on Tuesday and I reviewed this on a bad day for the market. This resulted in 3 companies and this was the best candidate

I set the scan to:
Revenue Growth: +25% - >100%
Current Price: $20 - $50
EPS Growth: 15% - >100%
Volume: >100,000sh
MACD Histogram: Negative to Positive
Price/Sales: 2, 2-3

I bought on Wednesday 2019-06-05 in the afternoon, because I expected a dip. The stock had gone up 4 straight days and the MACDH had changed to positive. I am currently down a small percentage and looking to exit quick if it starts to move against me.

This Day 3 of a 7 Trading Day Time Stop. The IBD Rankings are below the CANSLIM standard
IBD Rankings 06/09/19
Composite Rating: 96
EPS Rating: 84
RS Rating: 94
Group RS Rating: A+
SMR Rating: B
Acc/Dis Rating: D+
ROE: 14.3%
Debt: 53%
Outstanding Shares: 266.3m
Float: 263.6m
EPS Due Date: 8/12/19

I got filled at $26.12
-5% Stop: $24.75
20% Target = $31.26

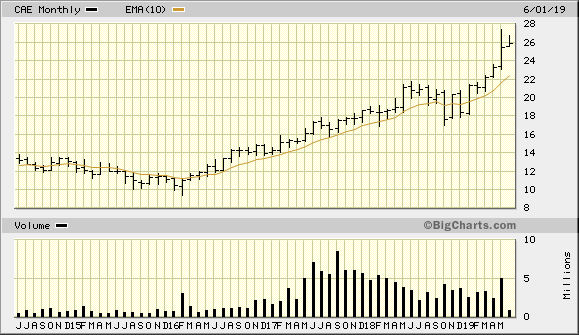
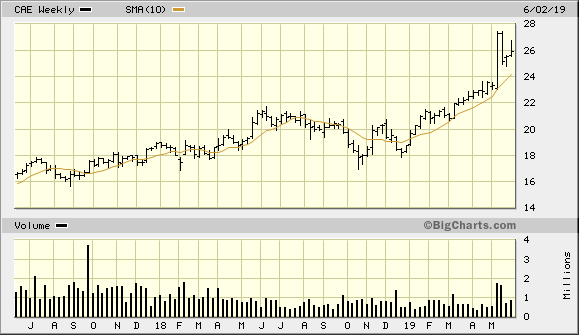
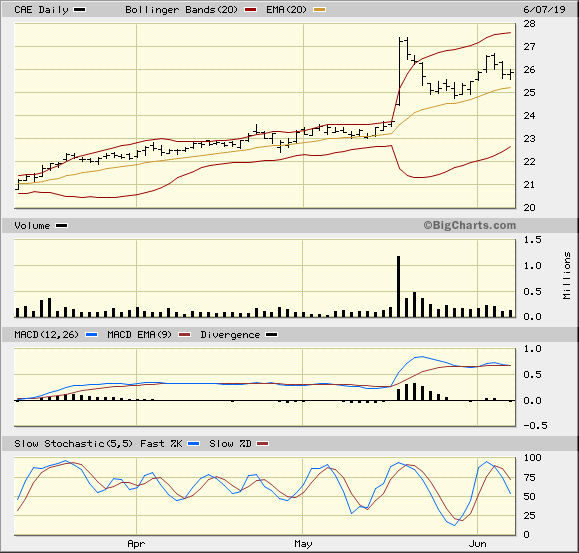
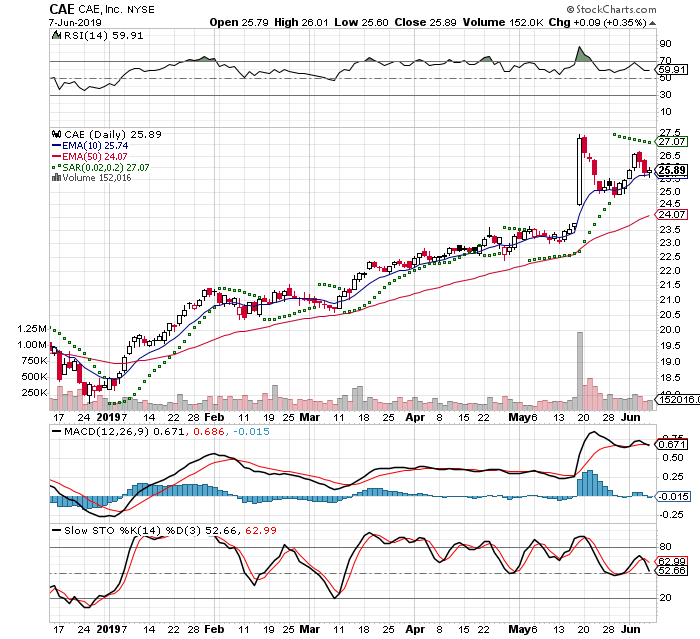
Dr Alexander has a triple screen for viewing charts and Trading for a Living is why I use the following charts

CAE 5 Year Monthly from BigCharts 2019-06-09
CAE 2 Year Weekly from BigCharts 2019-06-09
CAE 3 Month Daily from BigCharts 2019-06-09
CAE 3 Month Daily from StockCharts 2019-06-09

2019-06-13

I closed out the position today, because it hit my time stop. I had expected a pause, but then rebound. I got filled at $25.54 with a slight loss

$26.05 - 25.54 = -$0.51 / $26.01 = -2% in 7 days

CAE 3 Month Daily from StockCharts 2019-06-13

Hibbett Sports Inc – HIBB

About the company from Investor Relations

Hibbett, headquartered in Birmingham, Alabama, is a leading athletic-inspired fashion retailer with more than 1,100 stores under the Hibbett Sports and City Gear banners, primarily located in small and mid-sized communities. Founded in 1945, Hibbett has a rich history of convenient locations, personalized customer service and access to coveted footwear, apparel and equipment from top brands like Nike, Jordan, Adidas, and Under Armour. Consumers can browse styles, find new releases, shop looks and make purchases online or in their nearest store by visiting www.hibbett.com or www.citygear.com. Follow us @hibbettsports and @citygear.

2019-05-28

This trade idea came to me by running a scan from TD Ameritrade on Monday and was part of my weekly review.

I set the scan to:
Revenue Growth: +25% - >100%
Current Price: $20 - $50
EPS Growth: 15% - >100%
Volume: >100,000sh
MACD Histogram: Negative to Positive
Price/Sales: 2, 2-3

This produced one company - Hibbett Sports

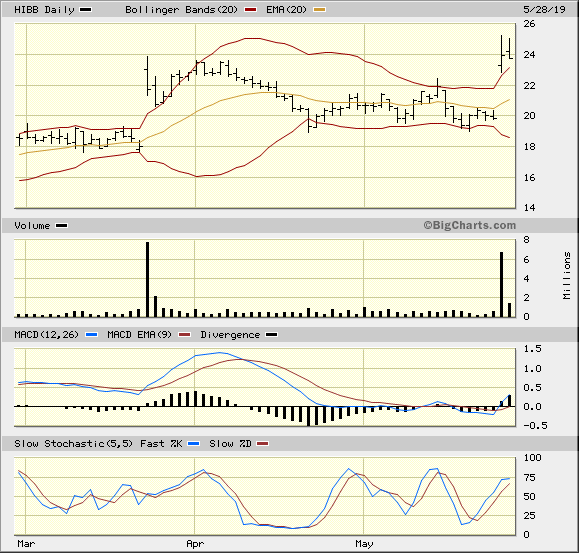
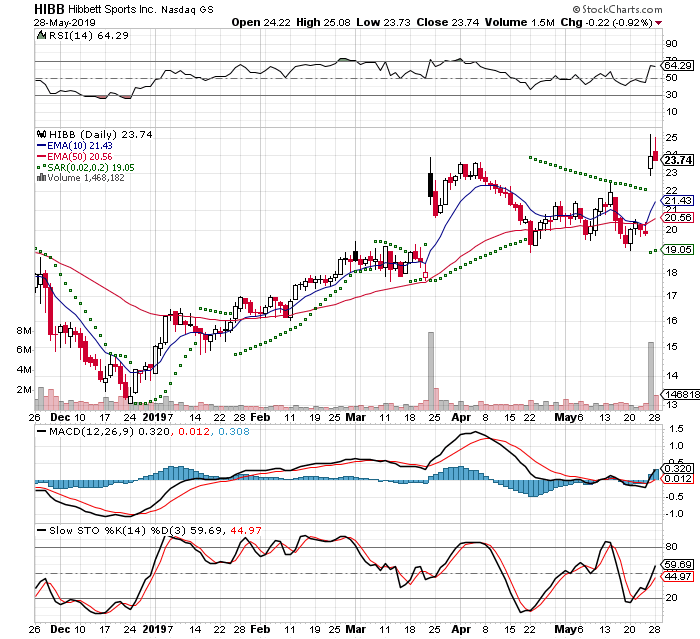
They have posted earnings and the stock popped. It was a buyable gap up and check out the setup: In The Trading Cockpit with the O'Neil Disciples: Strategies that Made Us 18,000% in the Stock Market

I placed a limit order at the previous day's close $23.95 on Friday. The morning open higher as expected and then stayed there through lunch. I had checked the stock at 2:20 EST and I felt that I would not get filled. I cancelled the limit order and bought the company. Of course it then drifted down and I would have been filled anyway. I ended the day with a -2% loss - drat

This Day 1 of a 7 Trading Day Time Stop. The IBD Rankings are below the CANSLIM standard

IBD Rankings 05/28/19
Composite Rating: 88
EPS Rating: 71
RS Rating: 93
Group RS Rating: A-
SMR Rating: C
Acc/Dis Rating: C+
ROE: 10.2%
Debt: 1%
Outstanding Shares: 18.4m
Float: 18.0m
EPS Due Date: 8/24/19

I got filled at $24.27
-3% below the intra-day low of the gap = $22.17
20% Target = $29.13

Dr Alexander has a triple screen for viewing charts and Trading for a Living is why I use the following charts

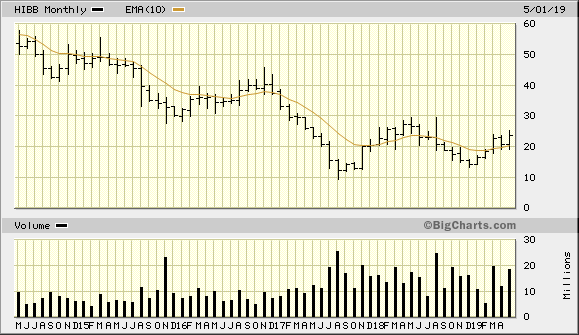
HIBB 5 Year Monthly from BigCharts 2019-05-28
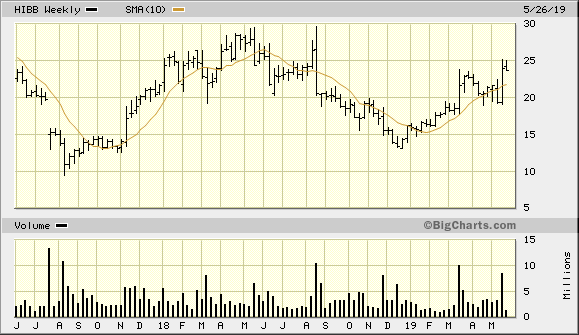
HIBB 2 Year Weekly from BigCharts 2019-05-28
HIBB 3 Month Daily from BigCharts 2019-05-28
HIBB 3 Month Daily from StockCharts 2019-05-28

2019-06-10

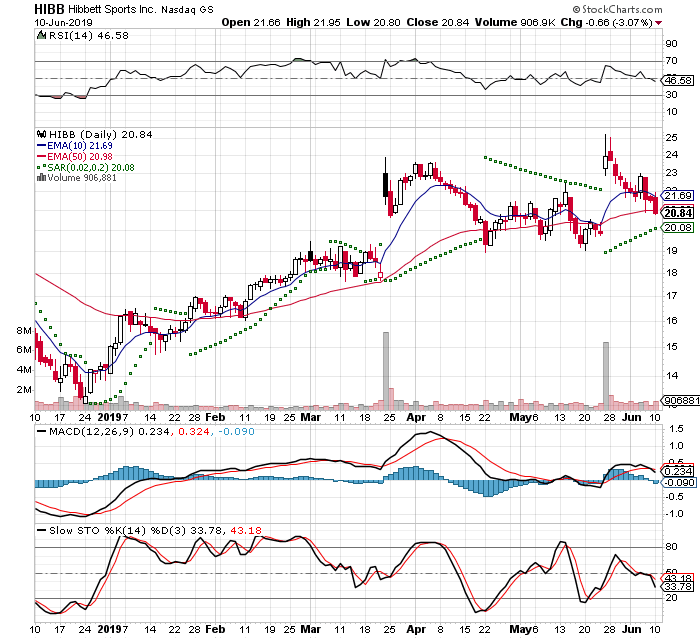
I closed out the position and got filled at $20.90. This had drifted lower on light volume and it went past my stop. It cost me a large loss

HIBB 3 Month Daily from StockCharts 2019-06-10