2021-07-25 DISH

DISH $41.68

This trade idea came to me by reviewing IBD Weekly VOL. 38 NO. 16 Week of July 26, 2021. I’ve tried modifying my stock screening and this is a test. Starting with an up and coming group

Monday Order
Buy to Open 3 DISH Aug 20 2021 41.5 Call Limit 2.05 = $615 total risk.
EPS Announcement trade.
If this hits +50% then I should get my money back and the rest is a free ride. I have 3x leverage on a slightly In-The-Money option

Focusing on the Groups that are in Top 40 Groups with Blue color. The idea is to catch a group that is accelerating
#26 Telecom
This week rank: 25
3 week rank: 82
6 week rank: 108

So this sector came to my attention. Going to the group in paper and copied the entire group. I focused on $20-$50 range

This is an earnings play with EPS Announcement coming due 08/07/21. This is 10 trading days out and at the shortest time frame I like to purchase

Looking at Aug 26 Days till Expiration. Monthly’s instead of the weekly’s, because there is more volume. ITM because it’s the closest strike price

DISH Aug 20 21
Strike Bid/Ask Vol Op Int
41.5 Call 2.03/2.09 0 73
42.0 Call 1.78/1.85 0 181

IBD Ratings for DISH
ChecklistRating
Composite Rating: 94
EPS Rating: 81
RS Rating: 74
Group RS Rating: A
SMR Rating: A
Acc/Dis Rating: B

IBD Market: Confirmed Uptrend

P/E Ratio: 10.75x
No dividend

5yr Monthly from Bigcharts – Above 10 Month SMA. Forming a consolidation period after a Cup and Handle break out
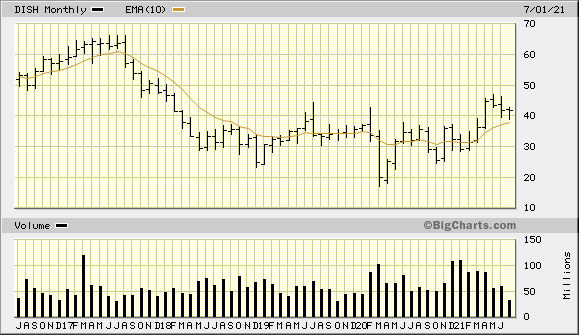
DISH 5 Year Monthly from BigCharts 2021-07-23

2yr Weekly from Bigcharts – Closed out the week at the 50 Week SMA
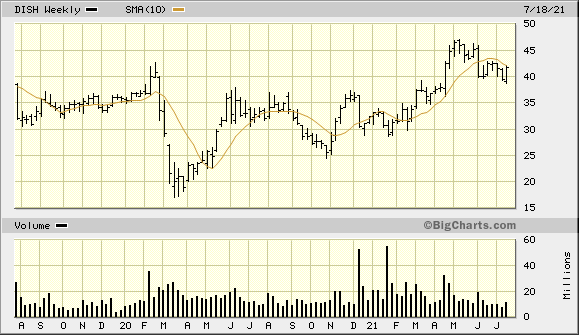
2yr Weekly from Bigcharts - Closed out the week at the 50 Week SMA
2yr Weekly from Bigcharts – Closed out the week at the 50 Week SMA

3mo Daily from Bigcharts – Above 20 EMA Bullish, Bollinger Bands contracting
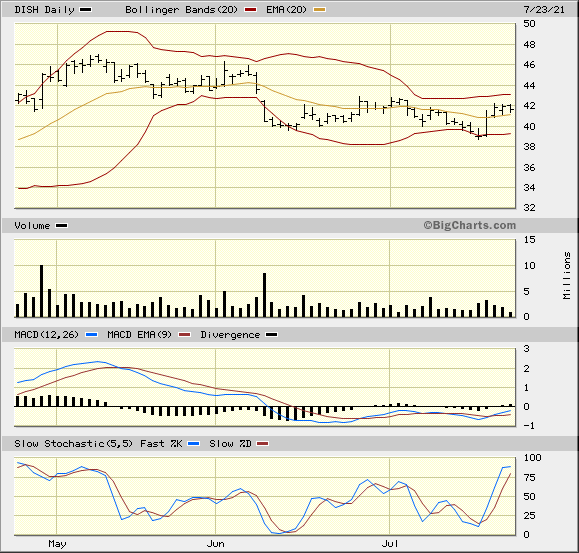
DISH 3 Month Daily from BigCharts 2021-07-23

DISH 3 Month Daily from BigCharts 2021-07-23

3mo Daily from StockCharts – My Standard Setup
RSI is midway 52.68
PSAR is below Bullish at 38.85. This is a floor the stop
10 Day EMA Above 41.04
50 Day EMA Above 41.32
MACD is trying to cross the zero line, but negative -.210. A strong trend is +/- 1
MACDH is already positive +.210.
Slow Stochastics is showing a positive trend 78.61
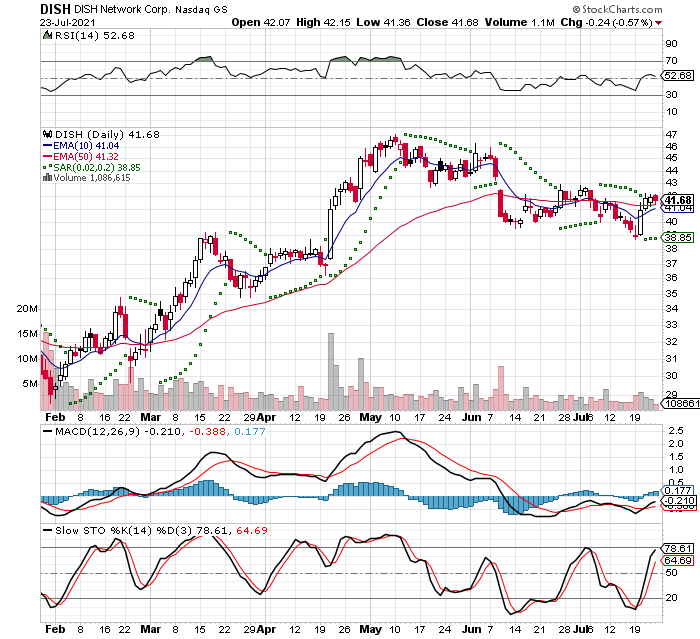
DISH 3 Month Daily from StockCharts 2021-07-23

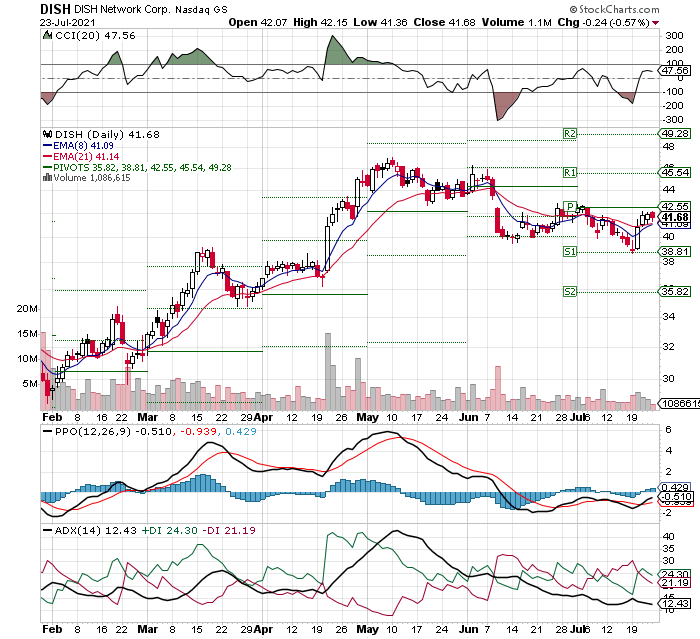
Jul 12th – 6 days of trading of complete selling. Then a large white candle on strong volume. 2 more days positive and Friday selling on light volume

Perfect Storm Trading additional screening
Pfizer Inc – PFE

Note: This is a trade idea. Please do you own due diligence

Investors Overview

This trade idea came to me by reviewing Investors Business Daily IBD Weekly Vol 37 NO 20 Feature article. The article covers Covid vaccines and Pfizer is currently in Phase 3. They are expecting to have a vaccine in October

I see this as a 5 month Cup and Handle formation and I liked the chart.

When I find something interesting there are a series of charts that I review. Dr Alexander has a triple screen for viewing charts and Trading for a Living. You start with the longest time frame

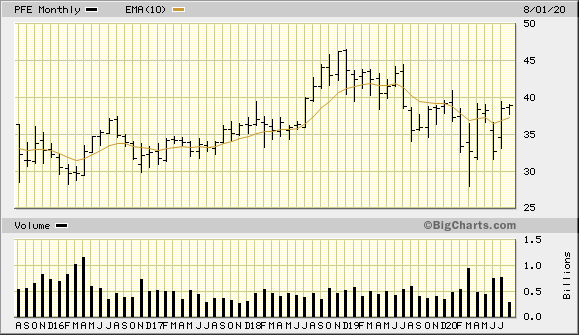
PFE 5 Year Monthly from BigCharts 2020-08-21

The longer term view I use is a 5 year monthly chart. I just have a 10 month Simple Moving Average (SMA) for a general trend. Above go Long. Below Short or pass on trade

The stock is currently 38.88 and have an upside target at 20% = 46.66 in new high territory. The stock is fighting a couple year downtrend

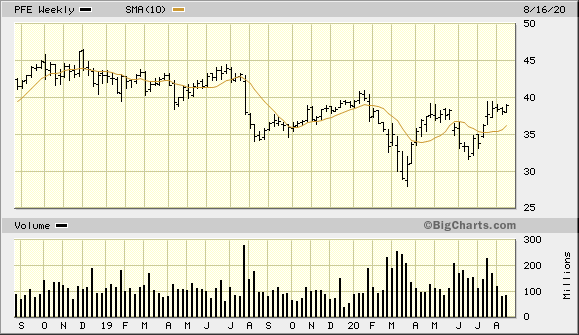
Then I review the 2 year weekly with a 50 week Simple Moving Average (SMA). This is roughly 1 year and here again I'm looking for the general trend. Above is good

PFE 2 Year Weekly from BigCharts 2020-08-21

52 Week Range:
40.97 - 27.88 = 13.09 / 40.97 = 31.9%

This is a shallow Cup at about -30% down and shows institutional support

Then I drill into 2 different 3 month views: Bigcharts and StockCharts

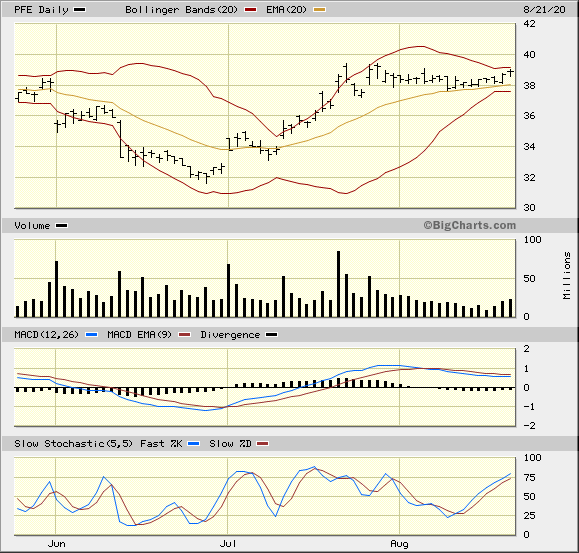
PFE 3 Month Daily from BigCharts 2020-08-21

The view is using Bollinger Bands from StockCharts. I like using a 20 day Exponential Moving Average to represent about 1 month of trading for the monthly trend. Moving Average Convergence Divergence MACD and Historgram

The idea of the trade plan is an option play past earnings. It's above the 20 Day EMA, Bollinger Bands are contracting, MACD is positive, but the Histogram is negative.

The stock will break out either up our down. I'm thinking that it will be on the upside, because the past few days have had increasing price with increasing volume. The Histogram is trending to the zero line

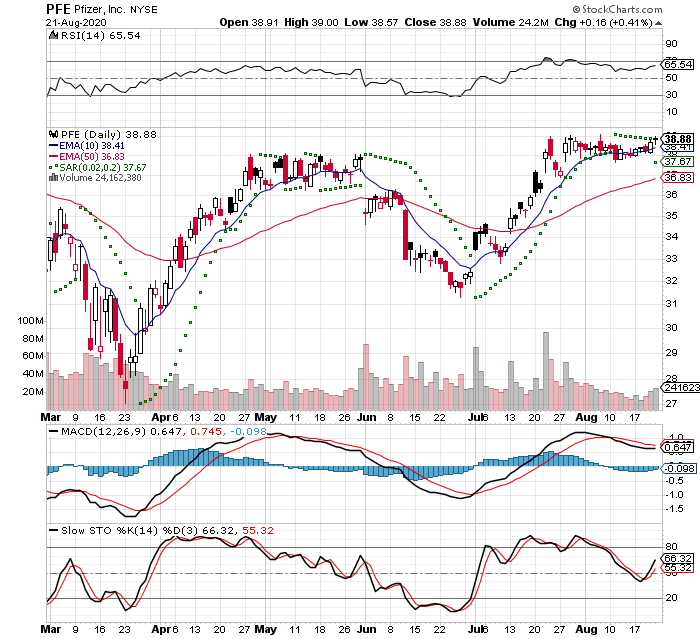
PFE 3 Month Daily from StockCharts 2020-08-21

This view is using Relative Strength Indicator RSI which is mid range with a slight up tic, Parabolic Stop And Reverse PSAR that I use to gauge if the short term trend is either positive or negative. This indicator can have many whipsaws, but I just use it as a general indicator

There is a MACD with slightly different parameters than BigCharts. Slow Stochastic is at the bottom

I placed an order: Buy to Open 2 PFE Nov 20 2020 39.0 Call Limit 2.20

Stop Loss -8% at $35.77

Upside Target +20% at $46.66
This will hit some resistance around $45 as it approaches the previous
range. That would be about a 10% gain, but I suspect that it would go
higher because of the recent trading.

IBD Rankings 08/21/19

Composite Rating: 78
EPS Rating: 73 - Little low
RS Rating: 76 - Little low
Group RS Rating: C+
SMR Rating: B
Acc/Dis Rating: A-
ROE: 26.4%
Debt: 56%
Outstanding Shares: 5556.9m
Float: 5501.3
EPS Due Date: 10/29/20. My trade is taking advantage of this event

From TD Ameritrade Quote Summary 08/19/20
P/E Ratio: 15.82x
Ex-dividend date: 07/30/20

Zacks has PFE as Hold - 3. I like to have confirmation from Zacks to confirm IBD

So this is a short term trade that will last approximately one month unless
the market moves against the trade

Until next time,
Bryan

Stewart Information Svcs – STC 2020-08-19

Note: This is a trade idea. Please do you own due diligence

Company Investors Relations

This trade idea came to me by reviewing Investors Business Daily Stocks on the Move. There is no real market for options and would be a long stock trade

I see this as a 9 month Cup and Handle formation and the recent trading activity sparked my interest.

Then it hit a new high 5 days ago and is currently down. I find the current trading activity interesting.

When I find something interesting there are a series of charts that I review. Dr Alexander has a triple screen for viewing charts and Trading for a Living. You start with the longest time frame

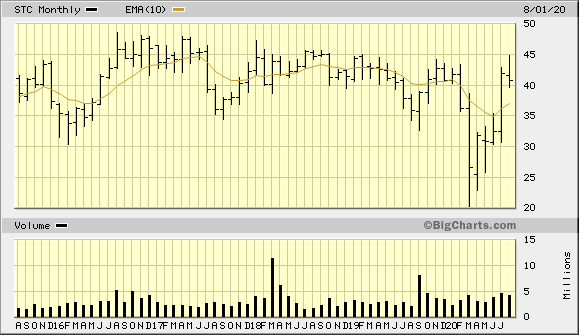
The longer term view I use is a 5 year monthly chart. I just have a 10 month Simple Moving Average (SMA) for a general trend. Above go Long. Below Short or pass on trade

STC 5 Year Monthly from BigCharts 2020-08-18

I am placing my upside target at 46.83 at the upper range of the long term high. This will hit resistance around $45.

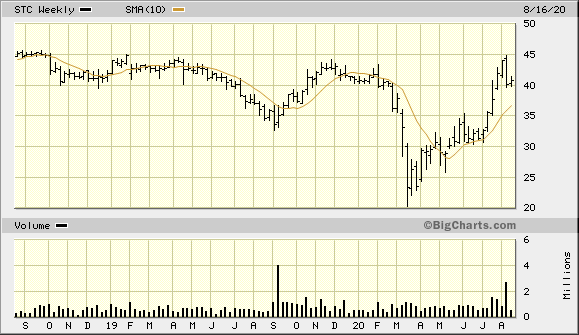
Then I review the 2 year weekly with a 50 week Simple Moving Average (SMA). This is roughly 1 year and here again I'm looking for the general trend. Above is good

STC 2 Year Weekly from BigCharts 2020-08-18

52 Week Range:
44.86 - 20.26 = 24.6 / 44.86 = 54.8%

This the deepest part of the Cup on the chart Apr 24 - Mar 20. However, most of the market has a similar chart

Normally we are looking for a Cup that is -40% deep

At -50% deep, a very different type of speculator evolves, because they see a decline of -50% and look to double their money and get out, instead of having a long time commitment

A Cup that is only -40% down means that there is institutional support at this level. They have the deep pockets for the research teams and will be buying when the stock dips to this level

Then I drill into 2 different 3 month views: Bigcharts and StockCharts

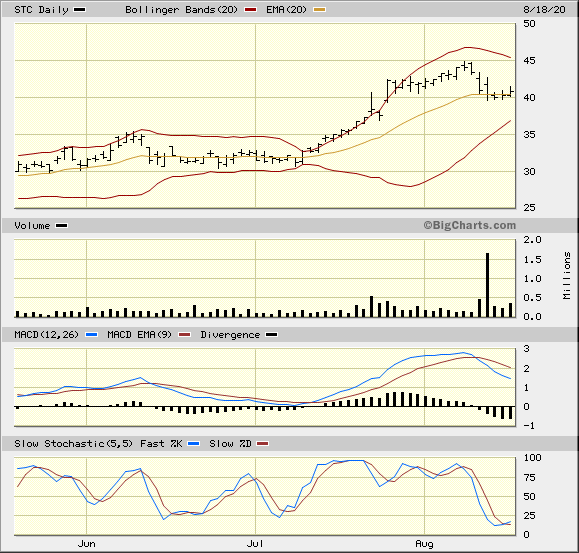
STC 3 Month Daily from BigCharts 2020-08-18

The idea of the trade plan is to take advantage of a temporary oversold situation. The view is using Bollinger Bands from StockCharts. I like using a 20 day Exponential Moving Average to represent about 1 month of trading for the monthly trend. Moving Average Convergence Divergence MACD and Historgram

Look at the heavy selling on 08/17, but it held at the 20 Day EMA. The stock seems to be weathering the selling an creating an oversold condition. Notice the last positive day on increasing volume

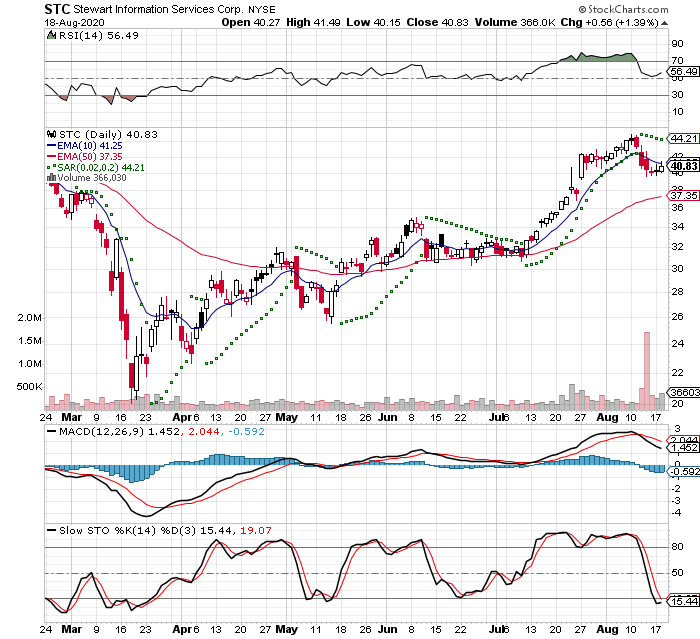
STC 3 Month Daily from StockCharts 2020-08-18

This view is using Relative Strength Indicator RSI which is midrange with a slight up tic, Parabolic Stop And Reverse PSAR that I use to gauge if the short term trend is either positive or negative. This indicator can have many whipsaws, but I just use it as a general indicator

There is a MACD with slightly different parameters than BigCharts. Slow Stochastic is at the bottom

I placed a Limit order for 100 shares at $40.83 - Previous Close. I got filled early in the morning

Cost: $40.83

Stop Loss -8% at $35.94
Looking at the chart I'm setting the stop at 36.11 which is the bottom shadow of the close before the recent gap up on 07/24

Upside Target +20% at $46.83
This will hit some resistance around $45 as it approaches the previous range. That would be about a 10% gain, but I suspect that it would go higher because of the recent trading.

IBD Rankings 08/19/20

Composite Rating: 86
EPS Rating: 93
RS Rating: 76
Group RS Rating: D+
SMR Rating: c
Acc/Dis Rating: B+
ROE: 9.3%
Debt: 14%
Outstanding Shares: 23.7m
Float: 23.0m - Thin
EPS Due Date: 10/22/20. I am not planing on staying for this event, but I could capture the dividend

From TD Ameritrade Quote Summary 08/19/19
P/E Ratio: 9.21
Ex-dividend date: 10/22/20

Zacks has a Strong Buy - 1. I like to have confirmation from Zacks to confirm IBD

So this is a short term trade that will last approximately one month unless the market moves against the trade

Until next time,
Bryan

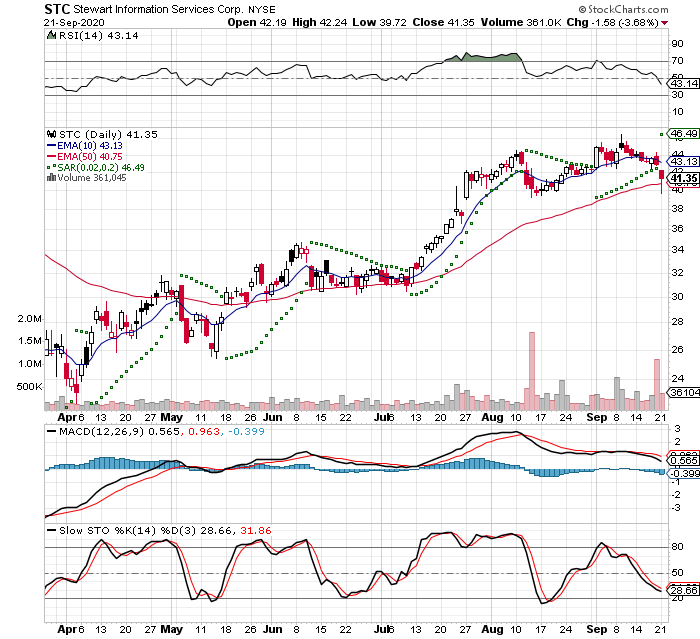
2020-09-21

I closed out of this position today, because I was up 10% and today it gaped down. I sold about noon ET. I got filled at 40.07 and had a loss of -76.10 or -1.86%

STC 3 Month Daily from StockCharts 2020-09-21

Switch Inc Cl A – SWCH

Switch About Us

2020-05-12

This trade idea came to me when I was reviewing my watch list. It was featured in Investors Business Daily: New America Vol 37 No 3 Week of April 28, 2020. I liked the chart and waited for a pull back to enter the position

I went with Call options to limit my losses. The Jun 19, 2020 Call option has 38 days to expiration and is lottery ticket. They are heavly leveraged and have a high P/E Ratio

I got filled this morning:
Buy to Open 2 SWCH Jun 19 2020 19.0 Call Limit 0.55

IBD Rankings 05/12/20
Composite Rating: 85
EPS Rating: 10
RS Rating: 94
Group RS Rating: A
SMR Rating: C
Acc/Dis Rating: A-
ROE: 5.1%
Debt: 387% – Heavly Leveraged
Outstanding Shares: 103.0m
Float: 75.2m
EPS Due Date: 08/07/20

From TD Ameritrade Quote Summary 05/12/20
P/E Ratio: 223.25x – Price is way out of line with actual earnings
Ex-dividend date: 05/21/20

Zack’s has this as 2 – Buy: SWCH

Dr Alexander has a triple screen for viewing charts and Trading for a Living is why I use the following charts

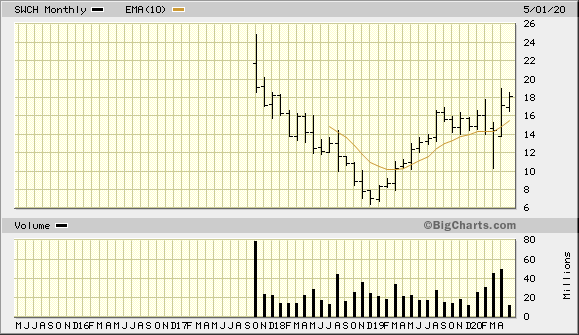
SWCH 5 Year Monthly from BigCharts 2020-05-12
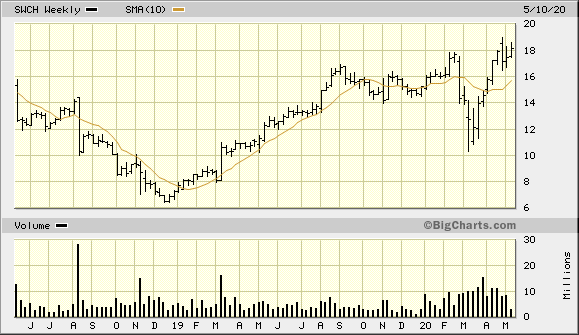
SWCH 2 Year Weekly from BigCharts 2020-05-12
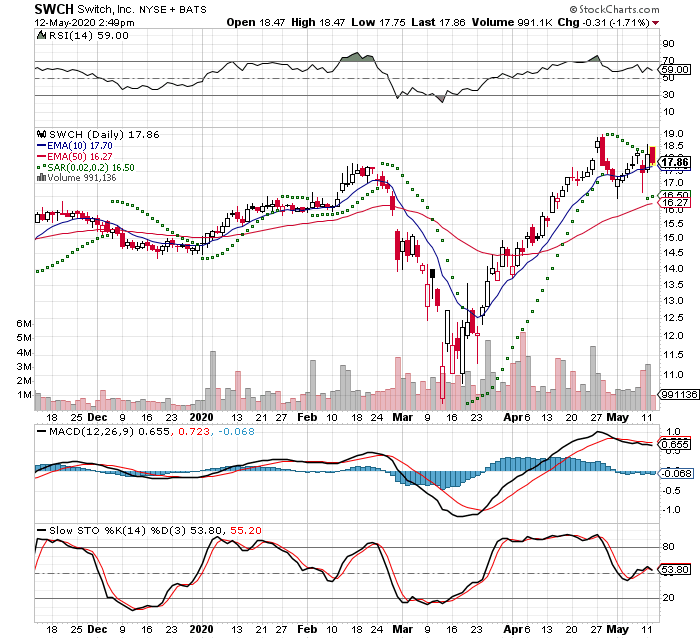
SWCH 3 Month Daily from BigCharts 2020-05-12
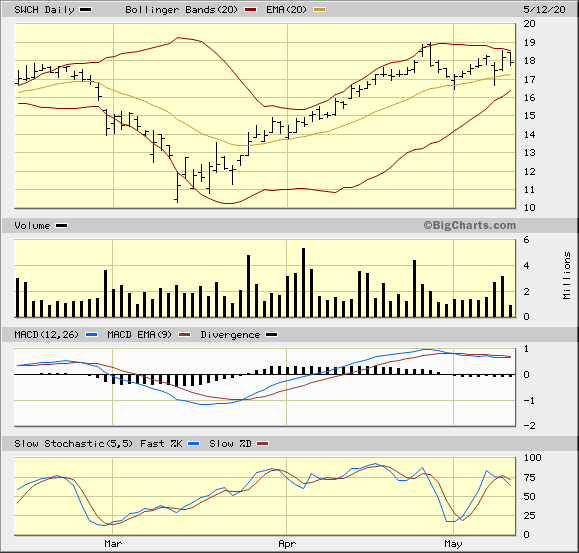
SWCH 3 Month Daily from StockCharts 2020-05-12

Silicon Motion Tech Ads – SIMO

Company Overview – About US

2020-05-08

This trade idea came from Investor’s Business Daily where is was featured in their IBD 50 over the past few weeks. It was #36 in IBD Weekly Vol 37 No 2, #34 in IBD Weekly Vol 37 No 2, and #29 in IBD Weekly Vol 37 No 2

My weekly review of charts SIMO caught my attention. It was in a tightening range and looking for it to break out. I decided to purchase Call options, because I wanted to limit the amount I could lose
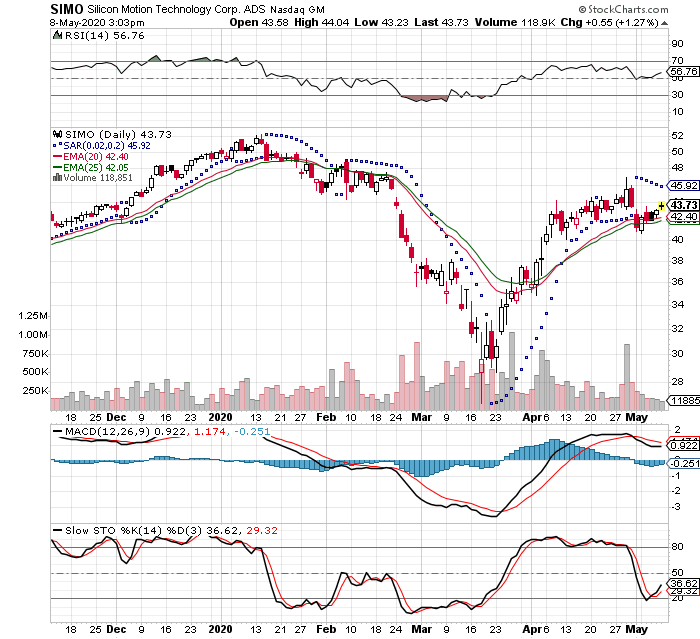
I bought this after lunch: SIMO Jun 19 2020 45 Call @1.55. The stock price around $43.50 at the time. This a stock substitution type of a play, because the earnings announcement is after expiration

IBD Rankings 05/08/20
Composite Rating: 90
EPS Rating: 86
RS Rating: 84
Group RS Rating: C+
SMR Rating: A
Acc/Dis Rating: C+
ROE: 17.2%
Debt: 0%
Outstanding Shares: 35.1m
Float: 32.0m
EPS Due Date: 07/30/20

From TD Ameritrade Quote Summary 05/08/20
P/E Ratio: 18.73
Ex-dividend date: 05/06/20

Zack’s has this as 2 – Buy: SIMO

Dr Alexander has a triple screen for viewing charts and Trading for a Living is why I use the following charts

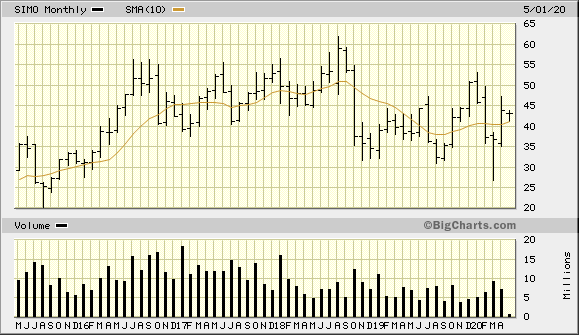
SIMO 5 Year Monthly from BigCharts 2020-05-08

This is above 10 Month SMA, but has been basically flat for 5 years

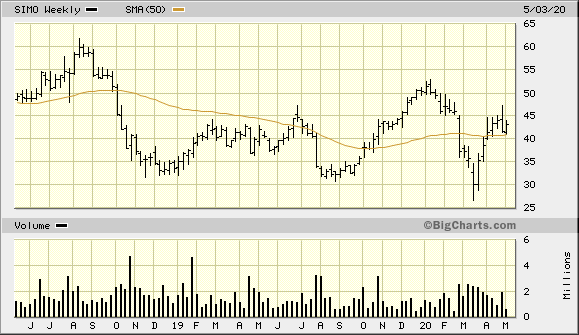
SIMO 2 Year Weekly from BigCharts 2020-05-08
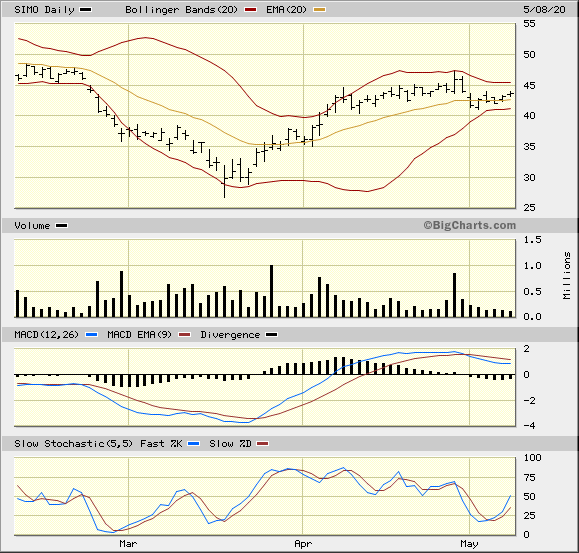
SIMO 3 Month Daily from BigCharts 2020-05-08

The Bollinger Band is squeezing tight and I’m thinking that it is going to break higher

SIMO 3 Month Daily from StockCharts 2020-05-08

If the stock drops to $40 a share I will sell to close to preserve capital. On the upside I will be selling at $60. The break even for the trade is at &46.56. I do not want to own the stock and will close this out before expiration

2020-06-16

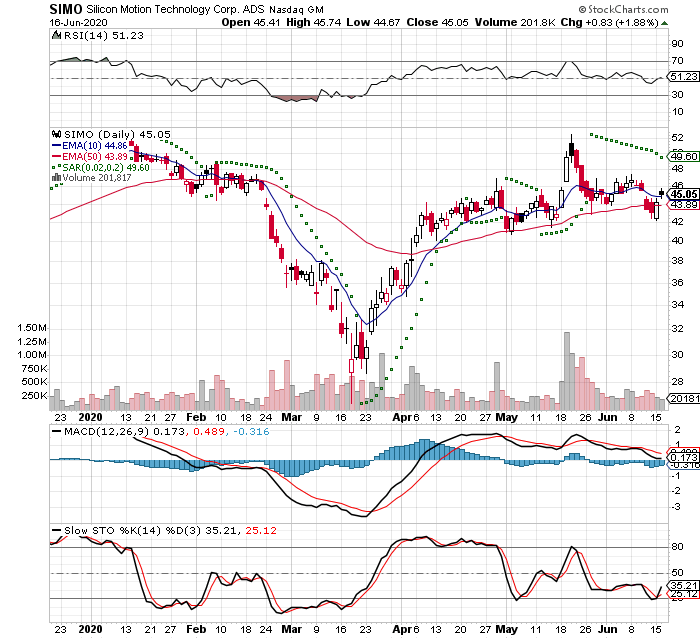
I closed out my position this afternoon, because it is close to expiration and I do not want to own the stock. I believe that the stock is not going to reach the $50/sh before earnings

The stock has been consolitating and I don’t have time left on the contract. This company will be on my watch list and may purchase again to capture earnings. I got filled at .95. That was a -67% loss and limited my loss at -$123.66. Lesson learned.

I had thought about selling after the pop, but waited. I was greedy and I should have closed out half the position then. I would have been playing with the house’s money

This is Stockcharts 3 month chart

SIMO 3 Month Daily from StockCharts 2020-06-16

Impinj Inc – PI

Inpinj.com About Us

Item Intelligence for the Internet of Things

If you’ve purchased apparel from a major retailer like Macy’s or Zara, run a race like the New York City Marathon, enjoyed a drink from a Coca-Cola Freestyle soda fountain, or checked bags at airports worldwide like Las Vegas McCarran then you’ve probably interacted with Impinj. Our platform enables wireless connectivity to billions of everyday items such as apparel, race bibs, golf balls, and luggage and delivers each item’s unique identity, location, and authenticity to business and consumer applications.

Impinj (NASDAQ: PI) is a leading provider of RAIN RFID solutions. Our platform, comprising both hardware and software, uses RAIN RFID to wirelessly connect everyday items to the internet, delivering digital life to the physical world. Impinj is helping companies around the world increase sales, improve efficiencies, and deliver compelling experiences.

2019-11-10

This trade idea came to me from my weekend stocks review. This was featured in Investor's Business Daily's Stocks on the Move on Tuesday 11/05. I had liked the long term chart and I bought the following day

I bought 100 shares and got filled at $34.69

Stop Loss -5% at $32.96
Upside Target +15% at $32.96

IBD Rankings 11/08/19
Composite Rating: 91
EPS Rating: 76
RS Rating: 96
Group RS Rating: A+
SMR Rating: D Warning
Acc/Dis Rating: C - I'm early
ROE: 0%
Debt: 18%
Outstanding Shares: 22.1m
Float: 15.9m
Management owns 21.15%
EPS Due Date: 01/24/20

From TD Ameritrade Quote Summary 11/04/19
P/E Ratio: --- Warning
Ex-dividend date: 02/20/20

Zack's has this as a Buy: PI

Dr Alexander has a triple screen for viewing charts and Trading for a Living is why I use the following charts

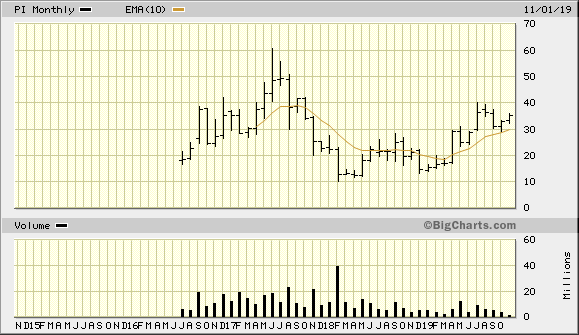
PI 5 Year Monthly from BigCharts 2019-11-05
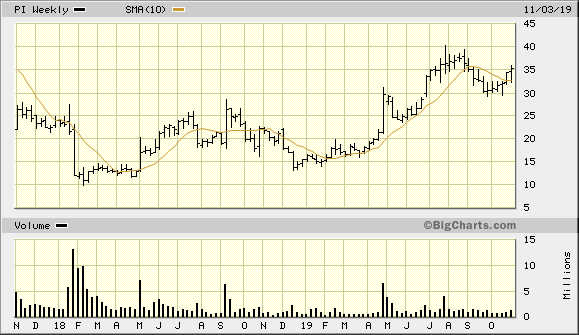
PI 2 Year Weekly from BigCharts 2019-11-05
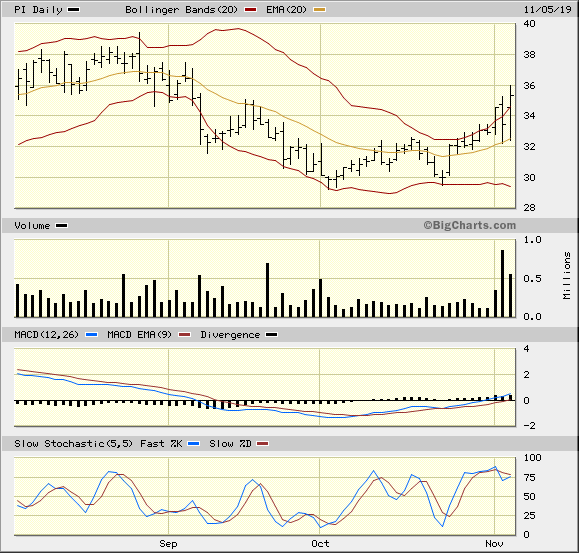
PI 3 Month Daily from BigCharts 2019-11-05
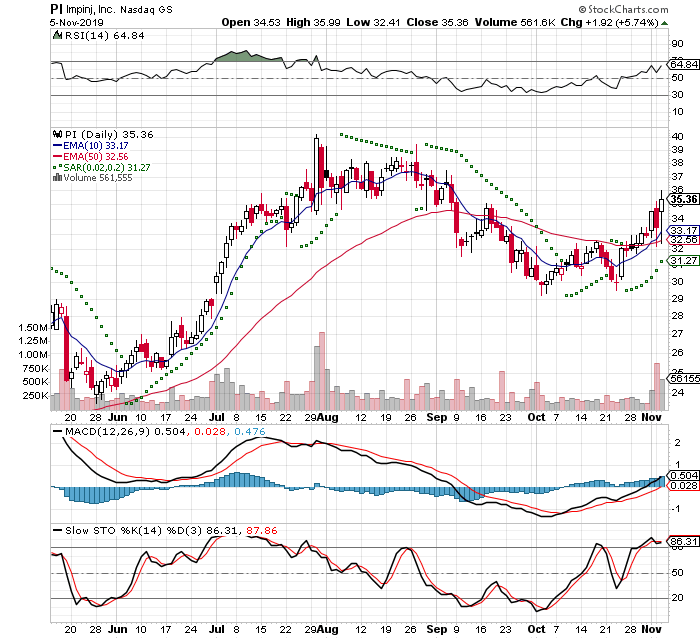
PI 3 Month Daily from StockCharts 2019-11-05

2019-11-18

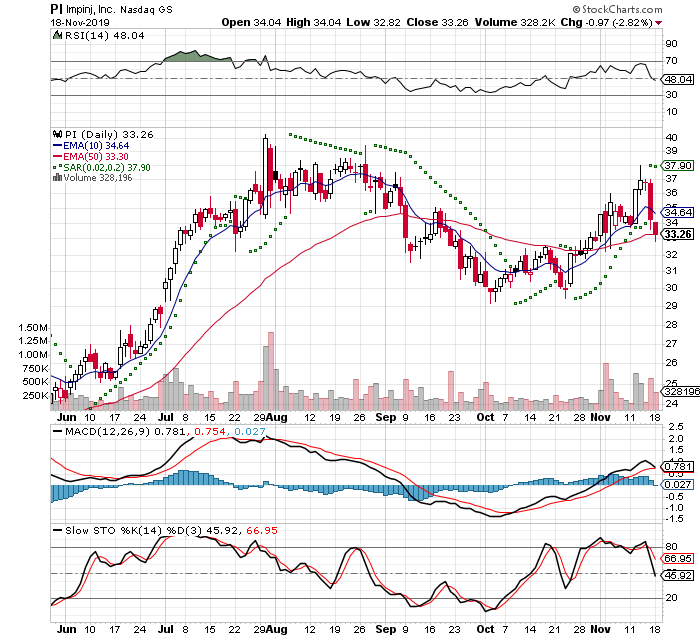
I closed out my position this morning, because the momentum reversed and I got out with a small loss. I feel the timing was too early and this will still be on my watch list. I got filled at $33.79

$34.69 - $34.79 = -$.90 / $34.69 = -2.5%


PI 3 Month Daily from StockCharts 2019-11-18

Hilltop Hldgs Inc – HTH

Hilltop-Holdings.com

About Us

With $14.8 billion in assets as of September 30, 2019, Hilltop Holdings Inc. (NYSE: HTH) is a Texas-based diversified financial holding company specializing in banking, mortgage origination, financial advisory and insurance through its wholly owned subsidiaries, PlainsCapital Bank, PrimeLending, National Lloyds Corporation, and HilltopSecurities.

2019-11-04

This trade idea came to me from my weekend stocks review. This was featured in Investor's Business Daily's Stocks on the Move on Friday's issue. They had recently posted earnings and was starting to break out of a tight consolidation base

This stock has had a buy gap up and the momentum was starting to accelerate

Check out the setup: In The Trading Cockpit with the O'Neil Disciples: Strategies that Made Us 18,000% in the Stock Market

I bought 200 shares this afternoon and I got filled at $25.24

Stop Loss -5%
I am having a little tighter stop on this trade and it will place it just above the 50 day EMZ

Upside Target +15%
This will provide a 3:1 risk reward ratio. Depending on the speed that it reaches this target I can sell half the position to hold the rest for a longer term gain

IBD Rankings 11/04/19
Composite Rating: 93
EPS Rating: 85
RS Rating: 90
Group RS Rating: C+
SMR Rating: C
Acc/Dis Rating: B+
ROE: 6.3%
Debt: 3%
Outstanding Shares: 92.8m
Float: 72.4m
Management owns 21.15%
EPS Due Date: 01/24/20

From TD Ameritrade Quote Summary 11/04/19
P/E Ratio: 11.3
Ex-dividend date: 11/14/19

Zack's has this as a Strong Buy: HTH

Dr Alexander has a triple screen for viewing charts and Trading for a Living is why I use the following charts

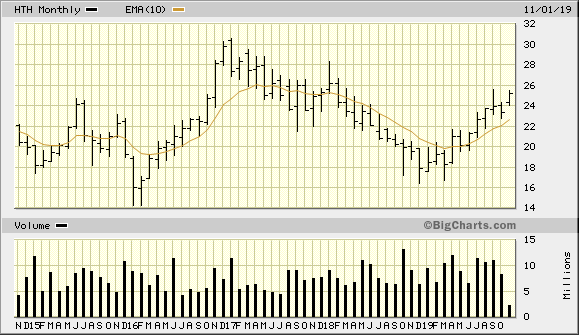
HTH 5 Year Monthly from BigCharts 2019-11-04
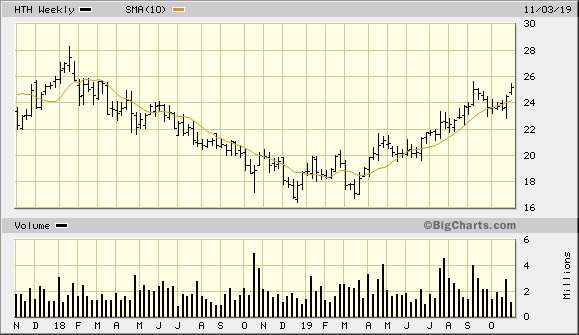
HTH 2 Year Weekly from BigCharts 2019-11-04
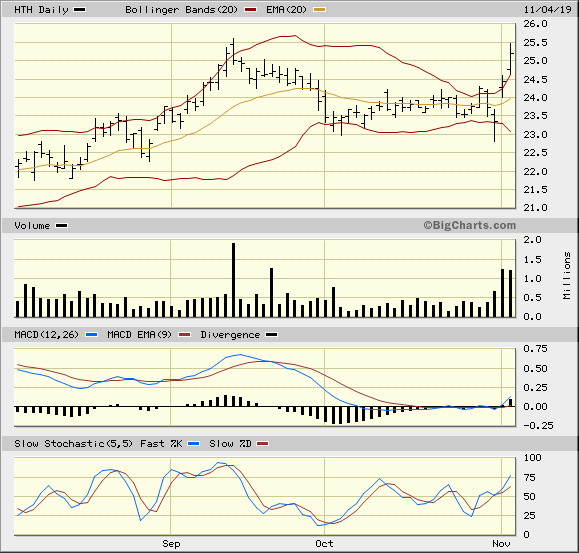
HTH 3 Month Daily from BigCharts 2019-11-04
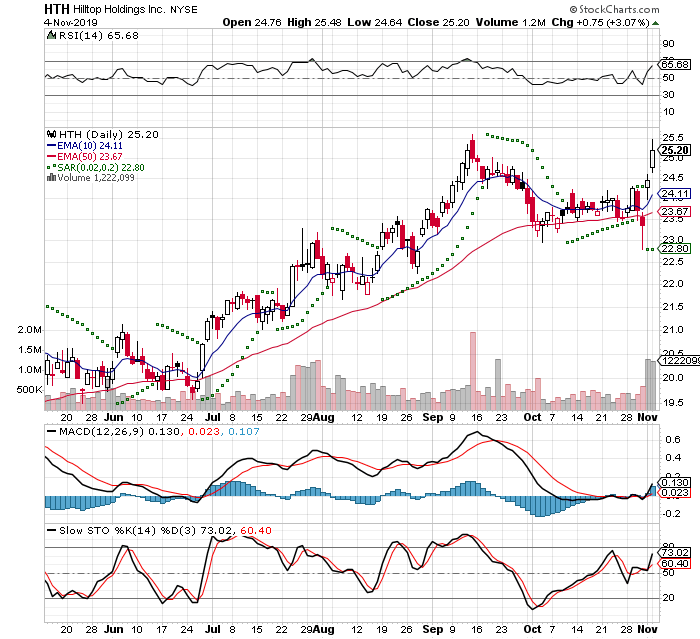
HTH 3 Month Daily from StockCharts 2019-11-04

2019-11-21

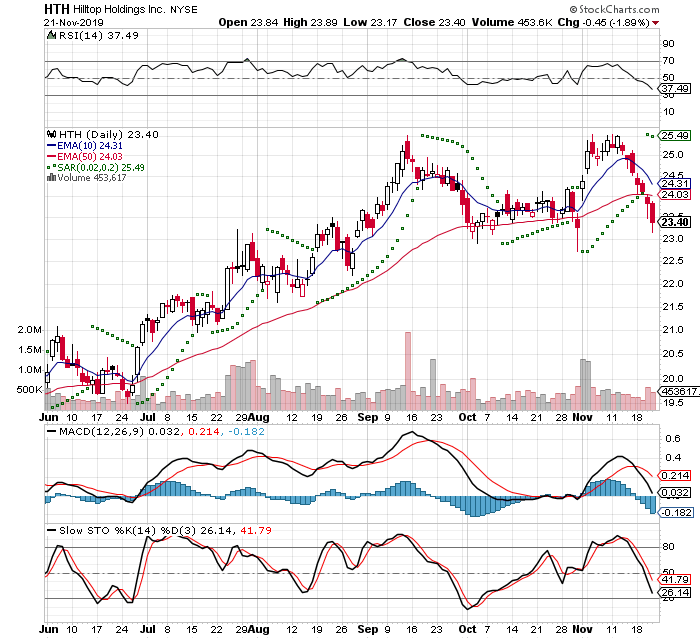
I closed out of the position today, because it moved against me and hit my stop. I got filled at $23.39

$25.24 - $23.39 = -$1.85 / $25.24 = -7.3%

HTH 3 Month Daily from StockCharts 2019-11-21

Vectrus Inc – VEC

Vectus Inc

From the Who We Are page

With more than 70 years experience, Vectrus has operated globally in a wide range of conditions from modern technologically advanced areas to austere contingency-based locations. Geographic areas of operation currently include: the Middle East (Kuwait, Qatar, and Bahrain), Central Asia (Afghanistan), Asia (Japan and Korea), Europe (Germany, the United Kingdom, Turkey, Italy and Romania), and the United States.

2019-10-17

This trade idea came to me from a friend of mine at the local IBD Meetup. This company was on open round of companies to review. I liked the chart and the way it was trading in the past few weeks

There are some warning flags like earning are not at the IBD standard. The EPS earnings are coming soon

I got filled at $43.09
50 day EMA stop at $41.29
+20% target at $51.71

The current IBD Rankings 2019-10-17

Composite Rating: 77
EPS Rating: 41
RS Rating: 95
Group RS Rating: A-
SMR Rating: C
Acc/Dis Rating: B
ROE: 17.2%
Debt: 31%
Outstanding Shares: 11.5m
Float: 11.2m
EPS Due Date: 11/06/19
PE Ratio 14
Ex-dividend date: None
EPS % Chg (Last Qtr)% -12

Zack's has this as a Hold: VEC

Dr Alexander has a triple screen for viewing charts and Trading for a Living is why I use the following charts


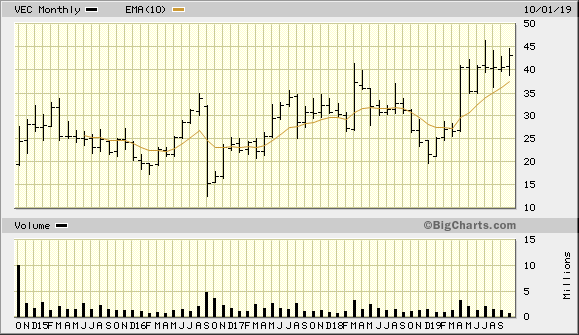
VEC 5 Year Monthly from BigCharts 2019-10-17
VLC 2 Year Weekly from BigCharts 2019-10-17
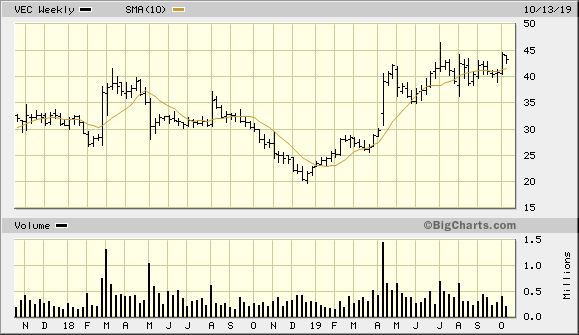
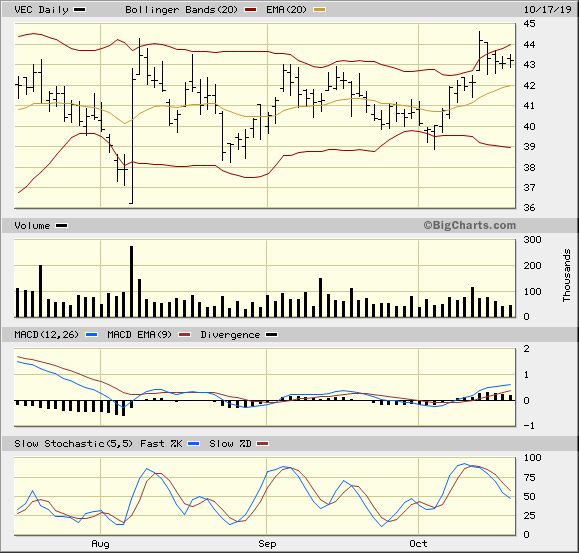
VEC 3 Month Daily from BigCharts 2019-10-17
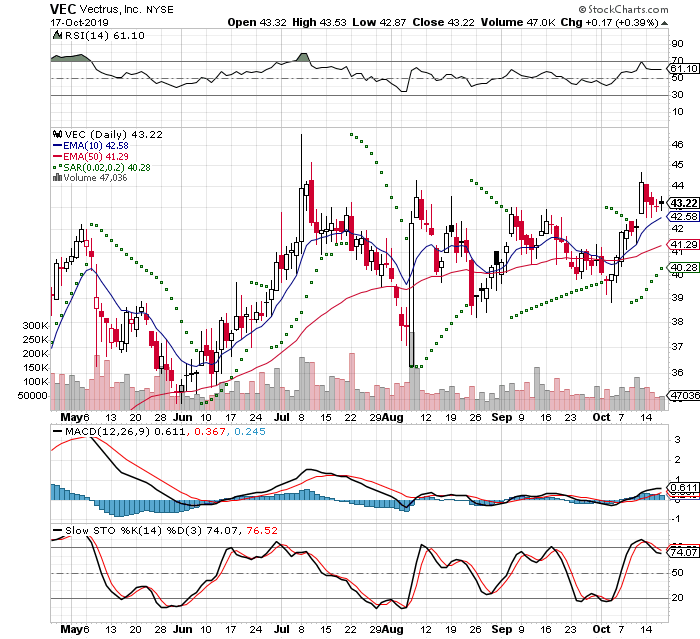
VEC 3 Month Daily from StockCharts 2019-10-17

2019-10-28

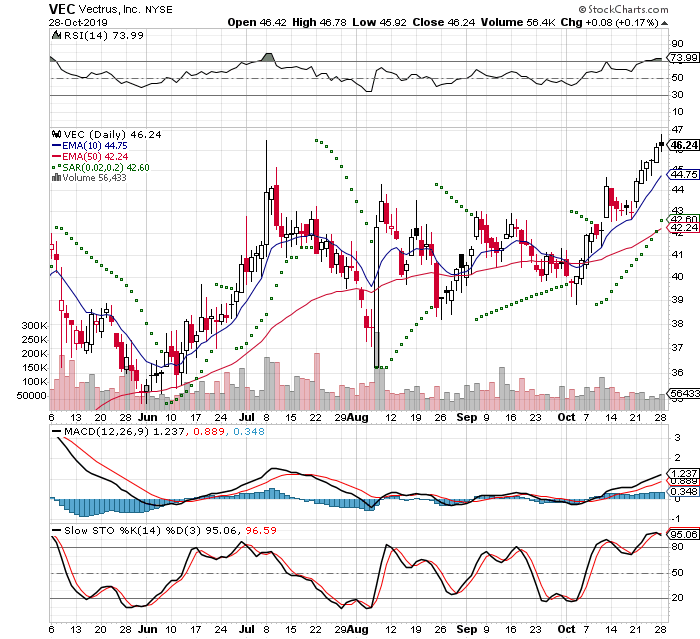
I closed out of my position today and got filled at 46.11. This had been going up on light volume and it is extended past the 10 day EMA. The earnings are coming up on 11/06 and I did not want to hold during the earnings announcement

$46.11 - $43.09 = $3.02 / 43.09 = 6.5% in 8 trading days

VEC 3 Month Daily from StockCharts 2019-10-28

United States Natural Gas Fund – UNG

UNG United States Natural Gas Fund

Fund Details

The United States Natural Gas Fund® LP (UNG) is an exchange-traded security that is designed to track in percentage terms the movements of natural gas prices. UNG issues shares that may be purchased and sold on the NYSE Arca.

The investment objective of UNG is for the daily changes in percentage terms of its shares' net NAV to reflect the daily changes in percentage terms of the price of natural gas delivered at the Henry Hub, Louisiana, as measured by the daily changes in the Benchmark Futures Contract, less UNG's expenses.

The Benchmark is the futures contract on natural gas as traded on the NYMEX. If the near month contract is within two weeks of expiration, the Benchmark will be the next month contract to expire. The natural gas contract is natural gas delivered at the Henry Hub, Louisiana.

UNG invests primarily in listed natural gas futures contracts and other natural gas related futures contracts, and may invest in forwards and swap contracts. These investments will be collateralized by cash, cash equivalents, and US government obligations with remaining maturities of two years or less.

UNG's Fund Benefits
  • UNG offers commodity exposure without using a commodity futures account.
  • UNG provides features including, intra-day pricing, and market, limit, and stop orders.
  • UNG provides portfolio holdings, market price, NAV and TNA on its website each day.

2019-10-08

This trade idea came to me by the book
Set up Buy the Feer and Sell the Greed
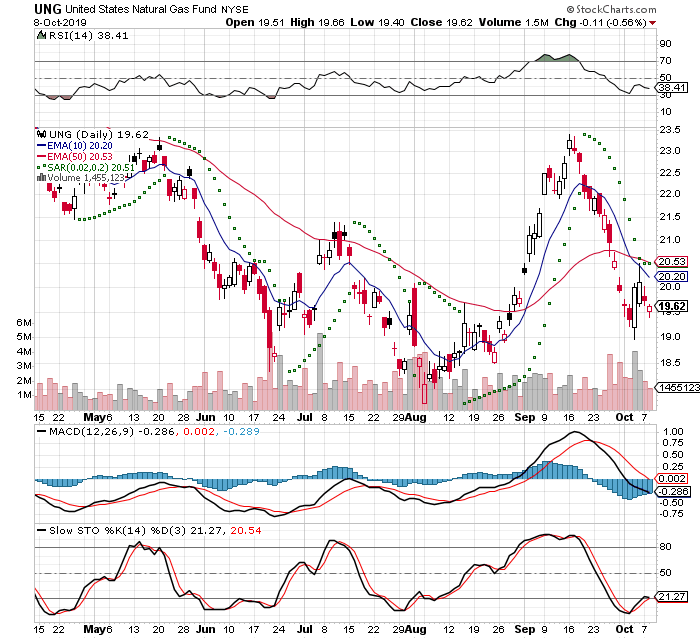
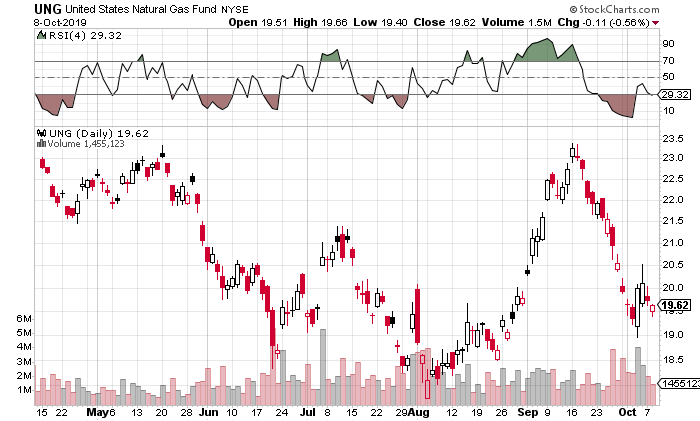
Buy 4 Day RSI oversold below 20 - was at 4.95 on 09/30
Sell 4 Day RSI reaches 50

The is an ETF that tracks natural gas. Liquefied Natural Gas was a hot topic by a couple of the keynote speakers at the Chicago Trade Expo this year. I had held off on purchasing and saw the value drop almost 30% from the May.

Then I saw it pop and have a significant move. I missed the move up and put it back on a watch list. I was looking for a good entry point. It started to drop and I was looking for a rounding out on light volume

That didn't happen and the selling started getting stronger. Then it gaped down and I decided on using a call option to limit the downside. I went will a slightly out of the money call option at $20 and went 46 days out to give me some time

UNG Nov 15 2019 20.0 Call
2019-10-01 Buy to Open $20 Calls Exp 11/15/19 2 contracts Filled at $1.16

The current price $19.65
Target $21.29 at 50 day EMA

Dr Alexander has a triple screen for viewing charts and Trading for a Living is why I use the following charts

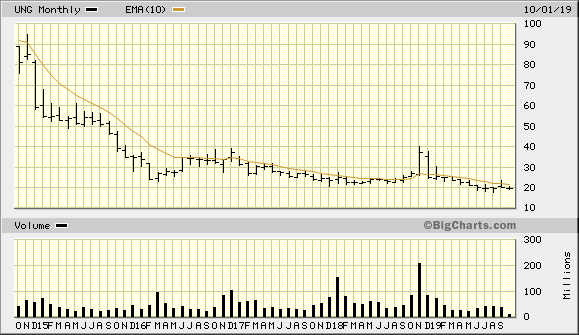
UNG 5 Year Monthly from BigCharts 2019-10-08
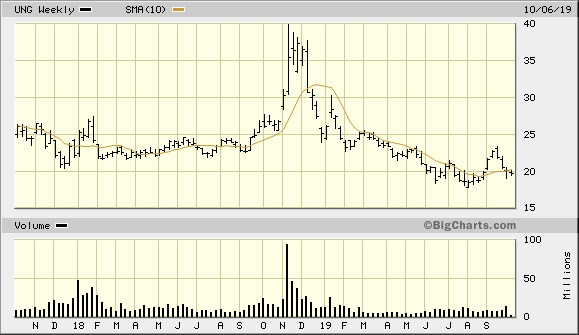
UNG 2 Year Weekly from BigCharts 2019-10-08
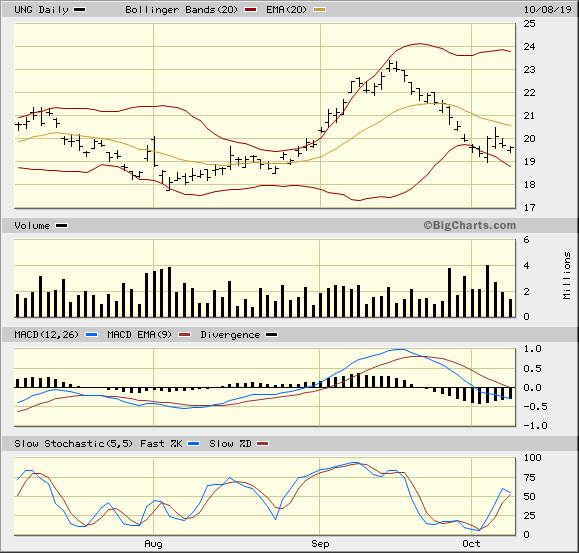
UNG 3 Month Daily from BigCharts 2019-10-08
UNG 3 Month Daily from StockCharts 2019-10-08
UNG 3 Month Daily from StockCharts 4 Day RSI 2019-10-08

2019-10-24

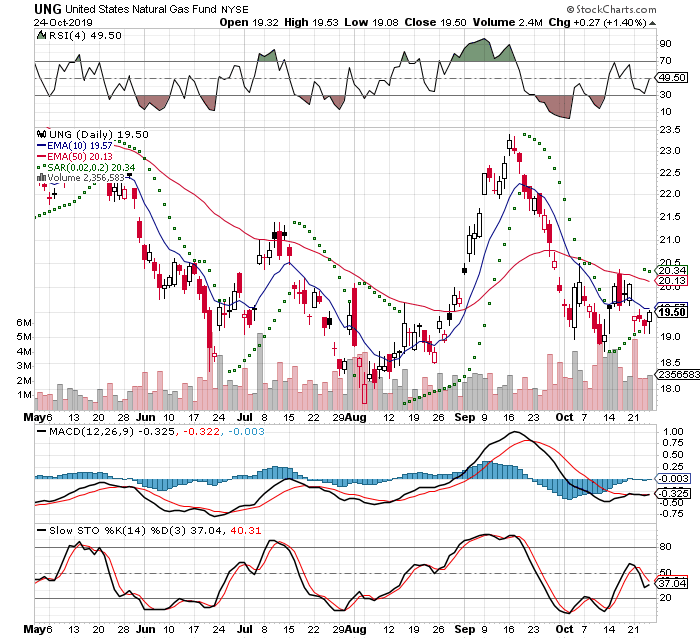
I closed out this position today, because I felt that it will not be a positive by the time the option expires. This position was positive for a day and basically covered the round trip costs. I think the biggest issue with the trade was the fact that it was below the long term average didn't allow it to lift off of the fear point

I will be adding a filter that a stock will need to be above a 200 day SMA

I got filled at $.63 and I'm glad I only had a Call option to limit my losses

$1.55 - $.63 = -.92 / 1.55 = -59%

UNG 3 Month Daily from StockCharts 4 Day RSI 2019-10-24

Enphase Energy Inc – ENPH

Investor Presentation

The Future of Home Energy Management

Enphase Energy, Inc. is a global energy technology company and the world’s leading supplier of solar microinverters. The Company delivers smart, easy-to-use solutions that connect solar generation, storage and management on one intelligent platform. Its semiconductor-based microinverter system converts energy at the individual solar module level and brings a system-based high-technology approach to solar energy generation, storage, control and management.

2019-09-22

This trade idea came from reviewing Investor's Business Daily Stock on The Move on Thursday 2019-09-19. I liked the chart and decided to buy off of that.

This was a buyable gap up and it closed the gap. In candlestick speak it closed the window and is finding support again.

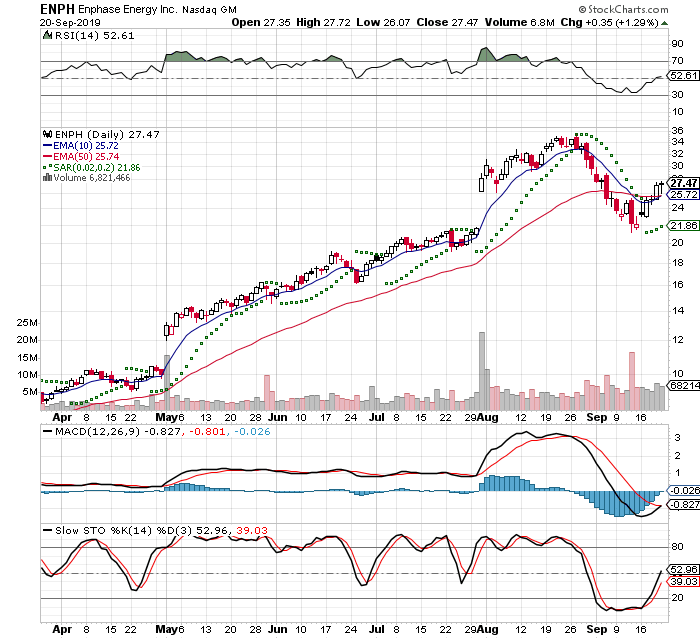
It passed several of the criteria and I saw the MACD and MACDH were crossing and turning positive. There were several moving averages were also crossing

It opened lower in the first hour of trading. Based on the moving averages I didn't think it would go lower and bought. That turned out to be a great fill

Check out buyable gap up setup: In The Trading Cockpit with the O'Neil Disciples: Strategies that Made Us 18,000% in the Stock Market.

The classic textbook on candlestick charting is Japanese Candlestick Charting Techniques, Second Edition

This is a risky trade please do your own due diligence

I got filled at $26.28

Stop Loss -19% at $21..25
This is a larger than normal range, but this is lowest it should go based on the current bottom. This is the max loss and will trim this if the trading going bad

Upside Target +35% at $35.42
This is the last New High and will meet some resistance at this level. I will hold to see how it trades at this level. I will sell off half of my position at this level

IBD Rankings 09/20/19
Composite Rating: 86
EPS Rating: 77
RS Rating: 99
Group RS Rating: A+
SMR Rating: N/A
Acc/Dis Rating: D
ROE: 12.60%
Debt: 1050% - Heavily Leveraged
Outstanding Shares: 122.0m
Float: 78.1m
EPS Due Date: 11/06/19
PE Ratio 344.84x
Ex-dividend date: None
EPS % Chg (Last Qtr)900%

Zack's has this as a Buy: ENPH

Dr Alexander has a triple screen for viewing charts and Trading for a Living is why I use the following charts

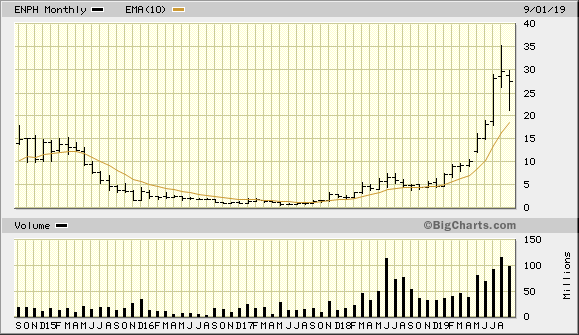
ENPH 5 Year Monthly from BigCharts 2019-09-20
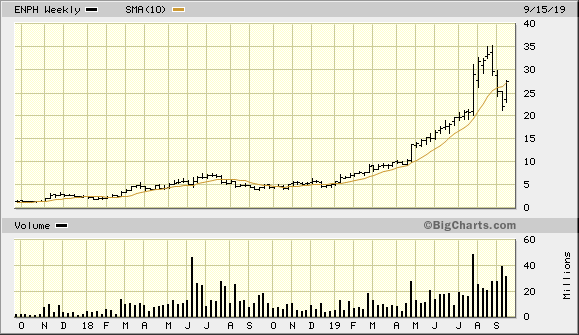
ENPH 2 Year Weekly from BigCharts 2019-09-20
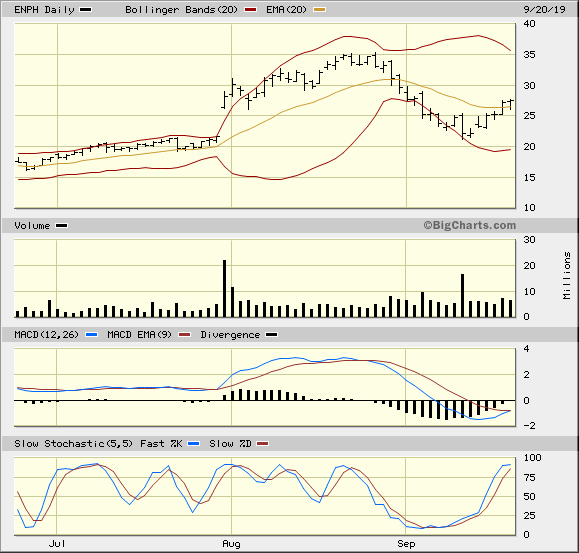
ENPH 3 Month Daily from BigCharts 2019-09-20
ENPH 3 Month Daily from StockCharts 2019-09-20

2019-10-23

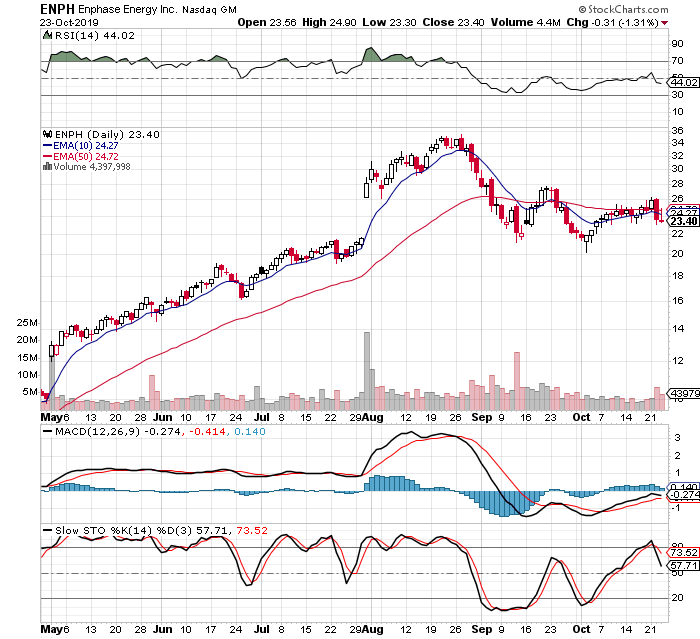
I closed out of my position today, because I see the market continuing to be against me. Yesterday was a very bad day and the way I'm reading the tape is this is an active short. I normally play the long side, because it is psychologically fitting for me

There was a double bottom and I had been expecting things to turn for the better. The stock was at a convergence point with a collapsing trading range and a tightening of moving averages

I got filled at $24.17

$26.28 - $24.17 = -$2.11 / $26.28 = -8%

ENPH 3 Month Daily from StockCharts 2019-10-23