2019-03-06
I had been following this stock off and on for a while. A couple year's ago they had a great run up and I had missed it at the time. This was frequently featured in Investor's Business Daily IBD50 and was one of the best stocks of the year.
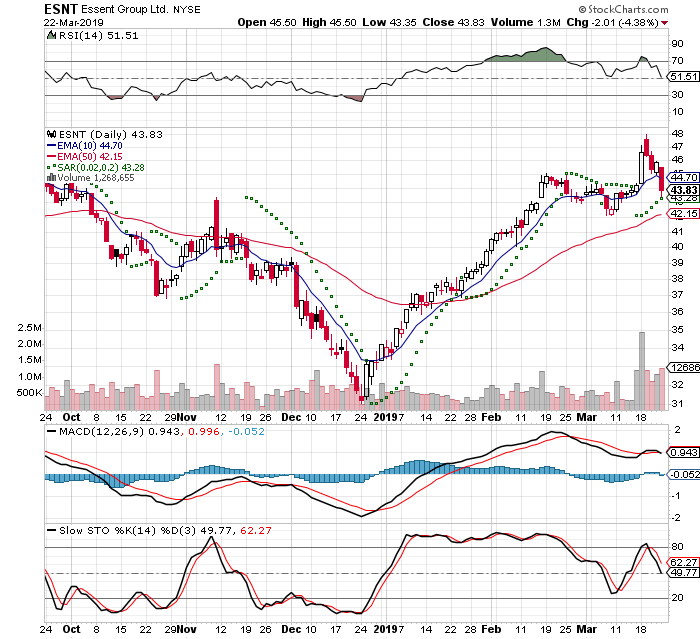
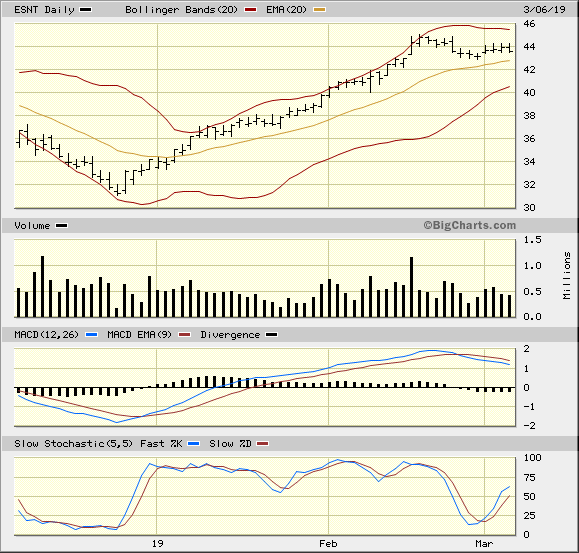
Then a little while back a friend asked me about this. It had a good run up since December and I wanted to wait for a dip. I put it on a watch list and I saw the PSAR flip below and that is a bullish signal. The way I was reading the tape - Accumulatin/Distribution I do not see any strong selling
I placed a market order for 100 shares about 11:30, because it had held and was a little off the previous day's close. This Day 2 of a 7 Trading Day Time Stop
I got filled at $44.08
-5% stop = $41.88
20% Target = $52.89
IBD Rankings 03/06/19
Composite Rating: 99
EPS Rating: 99
RS Rating: 86
Group RS Rating: A+
SMR Rating: A
Acc/Dis Rating: A-
ROE: 21.7%
Debt: 0%
Outstanding Shares: 98.3m
EPS Due Date: 5/2/19
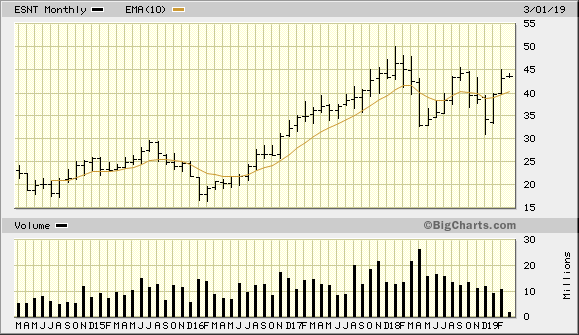
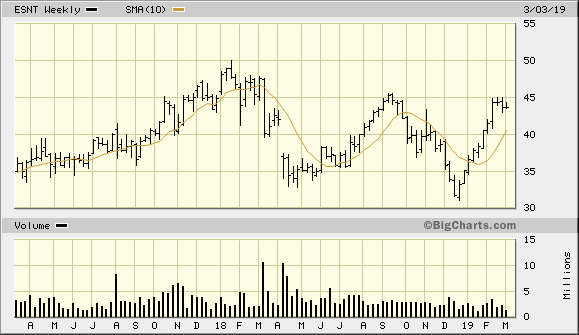
Dr Alexander has a triple screen for viewing charts and Trading for a Living is why I use the following charts
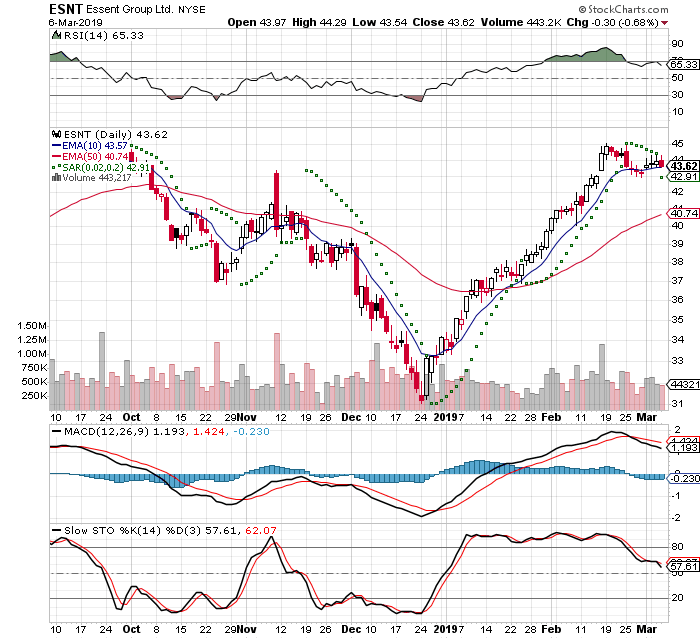
2019-03-07
I closed out of the position today, because I had expected a minor bounce and it had a small gap down. It was not recovering by midday and I cut the losses at about 3%.
I got filled at 42.64
44.08 - 42.64 = 1.44 / 44.08 = -3.3% 2 days
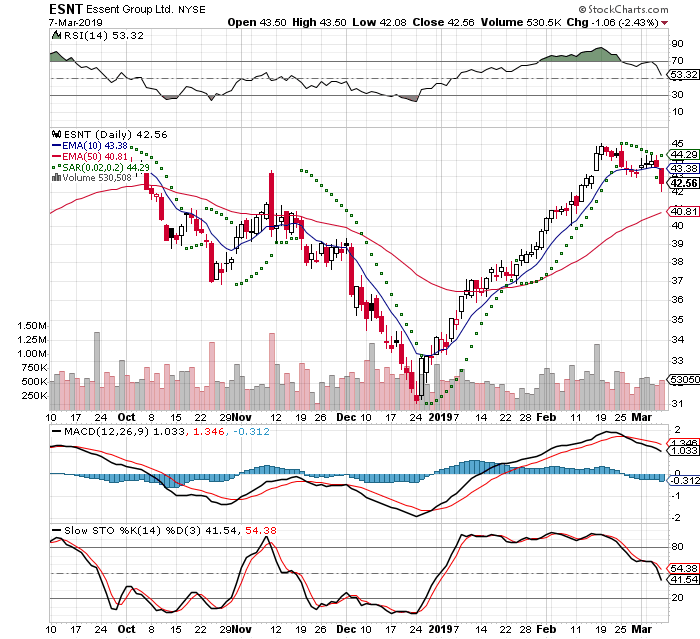
2019-03-18
I moved back into this company this morning. Friday it had started the breakout and was drawing the attention. Today was a good day +5.45% on +447% volume
I got filled at 44.55
-5% Stop: 42.33
+20% Target: 55.96
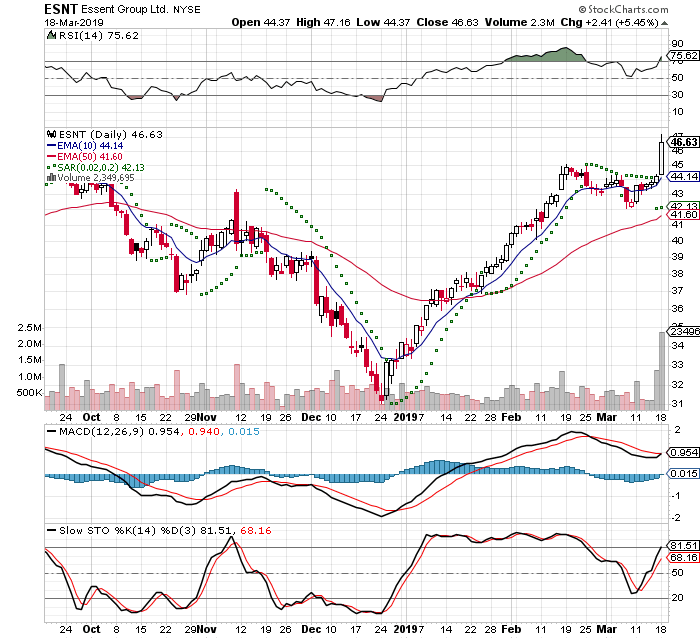
2019-03-24
I closed out my position, because of the general market sell off. This was close to reaching my -5% stop. Friday was a clear distribution day and reversed the overall trend.
The original entry point was incorrect, because I had gotten a bad fill. The market was at $44.55, but I actually got filled at $46.20. Thursday I was sitting on a gain and by lunch I was at a loss. I closed out to be completely in cash to reevaluate the market
I got filled at 43.91
46.20 - 43.91 = -2.29 / 46.20 = -5.00
Not good, but I walked away
