2018-10-31
This was in Investor’s Business Daily Stocks on the Move on 2018-20-25 and I bought 100 shars, because they had announced positive earnings. I had closed out VNDA and AMD and wanted to keep the cash active
I got filled at $31.65
-5% stop = $30.06
20% Target = $37.97
IBD Rankings today
Composite Rating: 98
EPS Rating: 99
RS Rating: 94
Group RS Rating: A-
SMR Rating: B
Acc/Dis Rating: B-
ROE: 6.8%
Debt: 34%
Outstanding Shares: 757.8m
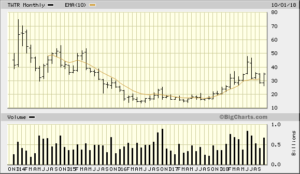
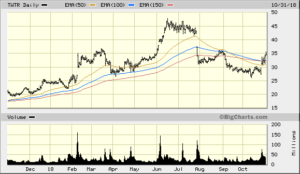
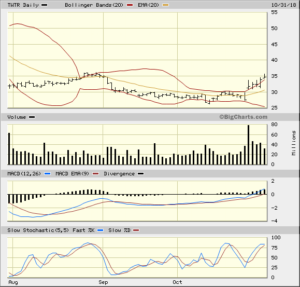
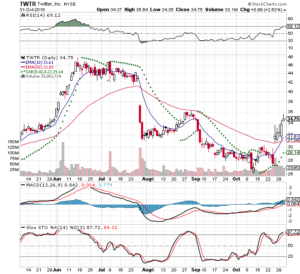
Dr Alexander has a triple screen for viewing charts and Trading for a Living is why I use the following charts
5 year monthly chart from bigcharts
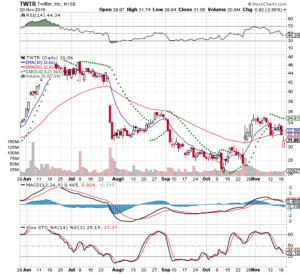
2018-11-20
I closed out my position today, because the overall market has been negative and TWTR is carried along with this tech crash. I had been up and today all of the gains were gone and I got filled at a -3% loss $30.66
2018-11-29
I took another bite at the apple, because I had seen a large black candle. I thought this was a good time to buy – I was wrong
I bought at the open and was stopped out 1 hour later. I was looking for a bounce off of the 50 Day EMA, but it didn’t and it rolled over
Buy $32.35
Stop $30.82
Close $30.66
That was a quick loss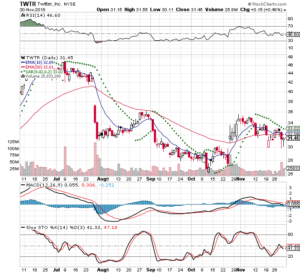
TWTR 3 Month Daily from Stockcharts 2018-11-30