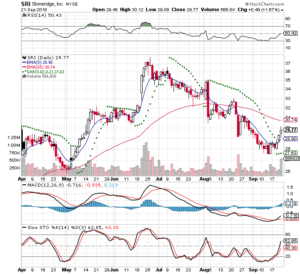
Stoneridge Inc – SRI
2018-08-21
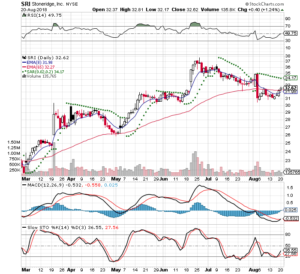
I started watching this on 2018-06-14 and looking for the right time to open a position. I am buying an Out of The Money $35 call Sept 21, 2018. The current price is $32.62
I am expecting the MACD cross over. I bought 3 $35 calls with September 21, 2018 expiration. At the time that I bought the stock price was at S32.72
I got filled at
-100% stop: -.50
300% Target: 1.50
IBD Rankings today
Composite Rating: 96
EPS Rating: 92
RS Rating: 93
Group RS Rating: A+
SMR Rating: B
Acc/Dis Rating: B
ROE: 18.2%
Debt: 51%
Outstanding Shares: 929m
EPS Due Date: 10/30/18
Dr Alexander has a triple screen for viewing charts and Trading for a Living is why I use the following charts
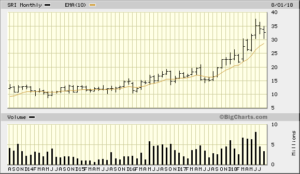
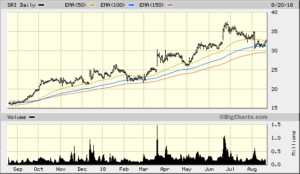
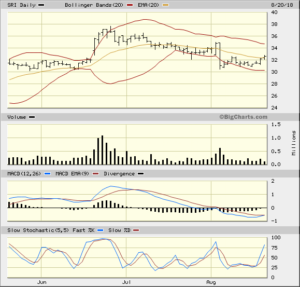
2018-09-23
Well this trade idea didn’t work out. I had expected the MACD and MACDH positive crossover. It didn’t happen and I lost the entire position
The PSAR is above and there was a big o’l red candle in August. The stock was already below the 50 EMA and was at the 100 EMA
There was no planned event happening so I had time decay working against me
This is the cost of tuition in learning the market. This was an impulse buy and was not a good setup
