FCAU 2018-04-03

2018-04-03 FCAU

Fiat Chrysler Automobile

This stock appeared in today’s Investor’s Business Daily Stocks on the Move
It closed today at $21.79 on strong volume and I liked the chart. They are posting earnings on Apr 26, 2018 and I wanted to buy the options beyond this date.

I placed an order for an out of the money call option:

Buy to Open $22.00 Call May 18, 2018 – 45 Days
IV 40%
Delta .5087
Open Interest 118

Current IBD Rankings
Composite Rating: 86
EPS Rating: 98
RS Rating: 97
Group RS Rating: C-
SMR Rating: C
Acc/Dis Rating: B

This is a large cap stock
1558.9m shares outstanding
PE Ratio: 7
Debt: 84%
ROE: 19.7%
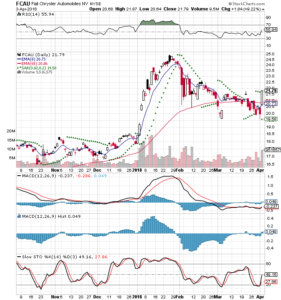
FCAU-StockCharts-3-mo-Daily-2018-04-03

Parabolic SAR flipped below
MACD crossed turning up
MACH flipped positive
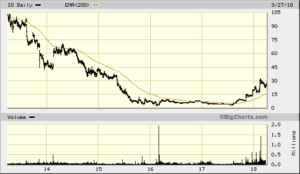
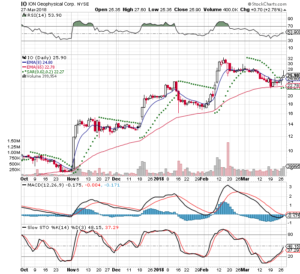
IO 2018-03-26

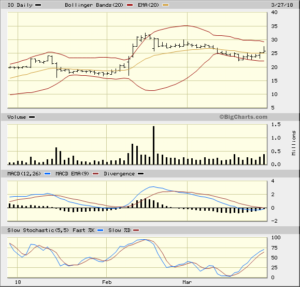
IO 2018-03-26

I O N Geophysical Corp (IO)

This stock came to my attention yesterday when it was in the Stocks on the Move in Investor’s Business Daily on 03-25-18.

This company works with US oil production and the price of oil is around $65 a barrel. In a recent article on the US Oil industry is expanding and OPEC is cutting production. I believe that this is positioned well

I bought 100 shares today at $25.09. If I’m right a 20% gain is $30.10 and I have a stop loss at $23.33. I had expected that the MACD would have crossed 0 today, but it didn’t and was close

Composite Rating: 87
EPS Rating: 79
RS Rating: 99
Group RS Rating: B-
SMR Rating: D
Acc/Dis Rating: A-

This company has a good bit of debt 395% and is a warning flag. This also has ROE: 0%

ID BigCharts 5 yr Daily
IO StockCharts 3 mo Daily
IO BigCharts 3 mo Daily
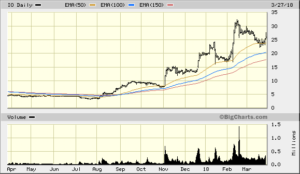
IO BigCharts 1 yr Daily

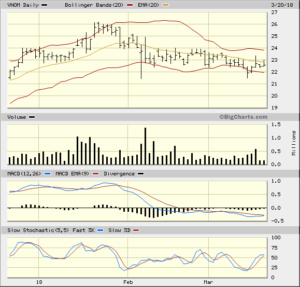
VNOM 2018-03-20

2018-03-20

Viper Energy Partners Lp (VNOM)

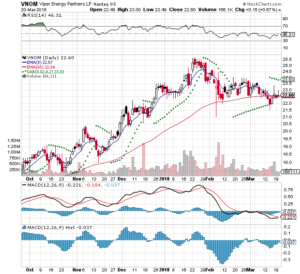
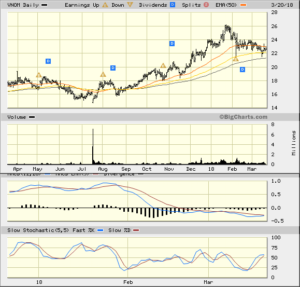
I have been watching this one for a few weeks. This was featured in IBD Weekly Vol. 34 N.O. 39 Week of January 1, 2018 and it was at $22.33. It then went to a high of $25.27 on Jan 24, 2018

I had missed this opportunity, because I was at the current limit for my risk tolerance at the time. It then sold off and is currently $22.60. Most of the selling pressure appears to be done

I placed a buy order tonight as a limit order for 100 shares at today’s close. This will need to have a tight stop loss at 5% or $21.48. On the upside I believe that this could rise to $25 before reaching resistance or about 10% gain. If it clears $25 resistance I will be placing another buy order for 100 shares.

IBD Rankings
Composite Rating 95
EPS Rating 99
RS Rating 85
Group RS Rating B-
SMR Rating A
Acc/Dis Rating
VNOM is ranked 1st in group
ROE 15.3%
Debt 10%
Sector: Energy
Industry Group Oil&Gas- US Expl&Prod

Earningswhisper.com has the earnings date as May 8th

Now for some charts

VNOM-2018-03-20-Bigcharts-3-Mo-Daily
VNOM 2018-03-20 StockCharts 3 Mo Daily
VNOM 2018-03-20 Bigcharts 1 Yr Daily
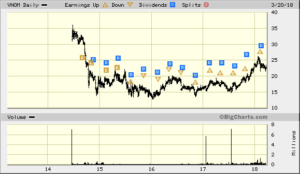
VNOM 2018-03-20 Bigcharts 5 Yr Daily

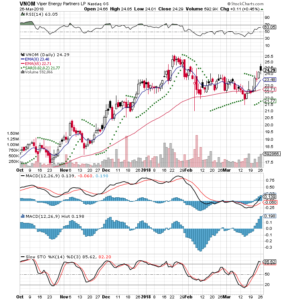
2018-03-26
This has been acting well and it looks like it’s clearing overhead resistence

2018-03-26 VNOM StockCharts 3 mo Daily


MOD 2018-02-02

2018-03/03
This stock had been having mixed results and I have had some positive days, but I have closed out the position for a loss


2018-02-02 MOD

Modine Manufacturing Company

I had gotten stopped out of my other positions and I bought at $22.15. I placed a -7% stop loss at $22.45. I had seen it break out on good volume and it wasn’t 10% past the buy point. I’ve been watching this company for the past couple of months

Current IBD rankings are:
97 Composite
95 EPS
96 RS
9.6% ROE
98% Debt

This has more debt than I like, but I liked the chart
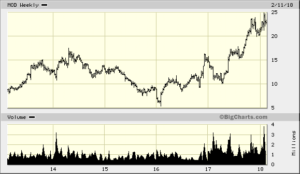
5yr chart from bigcharts.com

MOD 2018-02-13 5yr Daily

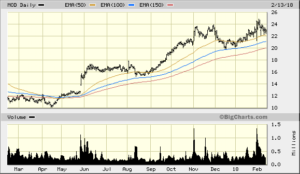
1 yr chart from bigcharts.com

MOD 2018-02-13 1yr Daily

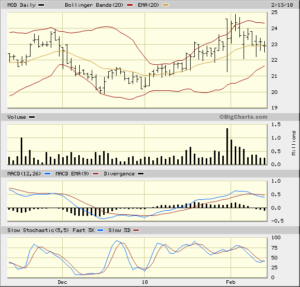
3 mo chart from bigcharts.com

MOD 2018-02-13 3mo Daily

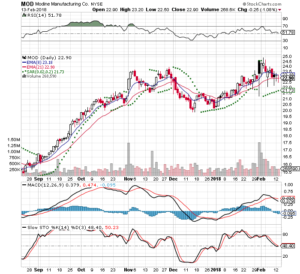
A different look from stockcharts.com

MOD 2018-02-13 StockCharts.com 3mo Daily

WLH 2018-01-22

William Lyon Homes

I bought this stock on  2018-01-22 at $32.33. I had been watching this stock for a while, but based on the market action I decided to make a buy. I have held this position for only a few days. I closed out my position out at 2018-01-31 $29.30 at a 9.3% loss

I focus on  the IBD ranking system and like to buy with a positive ROE and little debt:
98 Comp
97 EPS
94 RS
28.0 million shares
9% ROE
23% Debt

Above 20 day 20 EMA
Bolinger Band: Upper and Expanding
MACD: Positive 0.822
MACD Histogram: Positive .085
Slow Stochastic: .70

2017 Score Card

2017-12-31

Thank you for following along with me on my journey. The past year I have selected 8 stocks and I made money on 5 on them. So on balance I have about 60% win ratio. The returns were capped and I had 1 large loss of -10% due to a mistake. If this is the only time this catches me then the tuition is cheap

I exited the position and preserved capital. I then rolled this into another position that turned profitable and then 5 weeks into the new year I got stopped out. The net balance was positive which for any new business is a success. The total dollar amount was $136 on making 8 trades throughout the year using risk capital of $1,900 – $3,500.

I had attended seminar by the Institute of Trading and Portfolio Management in Jan 18. The presenter stated that there is a 90, 90, 90 rule:
90% of traders blowout
90% of their account balance in
90 days

I have survived and changing trading strategies. I had started last year using a covered call strategy and I do not feel that works with my personality. It concentrates on monthly income, but the risk is in owning the stock.

Last year was a record setting year. Capping your upside in this environment was a wrong idea. This next year I will be getting level 2 clearance from the brokerage account