SQ 2017-09-01
I closed out my position with KBH, because the stock did not act right. I had seen support at $23.oo a share and the stock slipped past that and then it started to roll over. I closed out at $21.34 at a 8.3% loss
$23.29 – $21.34 = $1.95- / $23.34 = 8.3%
I had wanted to own this company, tried to buy on a dip, and then sell a $25.00 call when the price rebounded. It was a profitable company and felt that it was oversold. It didn’t work out as expected – the market, sector, stock, or timing was wrong. So, I went to my short list of stocks that I’m considering.
I had come across Square Inc – SQ. This was in the price range that I am considering, because my line is limiting my choices right now and needed a lower priced company I bought 100 Shares of SQ at $25.796 plus commissions = $2,586.55
This was in Investors Business Daily, IBD Weekly, Vol 34, N.O 18, Week of August 7, 2017 IPO Leaders
I am selling a $27.00 Oct 20th call option against this stock for $.95 a share.
Sell to Open 1 Contracts of SQ OCT 20 2017 27.00 C (SQUARE INC) at Limit Price of $0.95. Duration of this order is Good until Cancelled.
A recommendation from Allen Ellman and most of the the books on covered call writing is: Do not sell a call during earnings reporting period. This is due to volatility. So, I then checked EarningsWhisper: SQ for the next earnings release. That is for Nov 1 so the Oct 20, 2017 call option is available.
Remember to do your own due diligence. This example is used to illustrate a trade.
The upside is $27.00 a share. This will generate a $1.20 in capital gains or 4.6%
27.00 – 25.80 = 1.20 / 25.80 = 4.6%
Selling the call gives me $95.00
$0.95 x 100 shares = $95.00
This is another 3.6% in yield
So the total return on the upside is $2.15 a share or 8.3%.
My downside limit is also 8%, but the extra $0.95 gives a higher probability for a successful trade. My cost basis for the stock is now $24.85 and an 8% loss is at $22.86. This is
25.80 – .95 = 24.85 * .92 = $22.86
Checking the Fundamentals for a profitable company:
| Gross Margin (TTM) | 36.64% |
| Operating Margin (TTM) | -3.80% |
| Pretax Margin (TTM) | -4.01% |
| Net Profit Margin (TTM) | -4.13% |
This trade is all off based on the fundamentals with negative margins!
Net Profit Margin tells you that out of every dollar of sale -4.13% hits the bottom line. This is currently loosing money.
P/E excluding extraordinary items (TTM) -121.70 They are losing money
P/Sales (TTM) 5.35 You’re buying the company 535% of current revenue and anything under 2 is considered cheap.
They have some cash on hand:
Current Ratio (MRQ) 2.3
Debt: 0% Investor’s Business Daily has 0%, but Yahoo has Total Debt/Equity (MRQ) 49.73
I like companies without a lot of debt, because that commits revenue. So, if it needs quick cash it will be able to meet short term needs it will be able borrow for the money. This is why the Quick Ratio does not bother me.
Return on Equity (TTM) -13.37%
EPS (TTM over TTM) -121.70
Book Value per share 1.84 This should be bottom line in pricing for liquidation
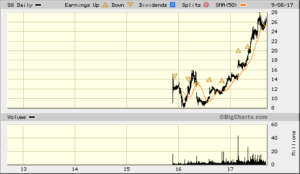
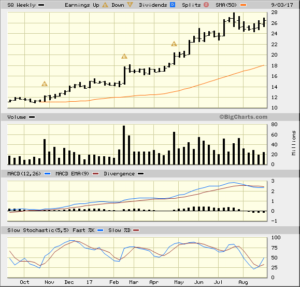
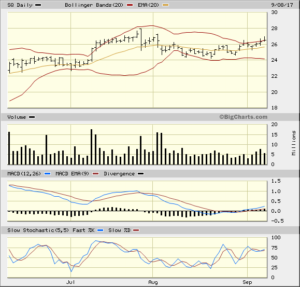
Let’s look how this is currently trading. Cover call strategy requires a positive overall trend. Starting with a longer view point helps give some perspective on the current trading cycle.
The charts are from bigcharts.com:
This is the current 5 yr chart

Next a current 1yr weekly chart.


Bryan