Note: This is a trade idea. Please do you own due diligence
Investors Overview
This trade idea came to me by reviewing Investors Business Daily IBD Weekly Vol 37 NO 20 Feature article. The article covers Covid vaccines and Pfizer is currently in Phase 3. They are expecting to have a vaccine in October
I see this as a 5 month Cup and Handle formation and I liked the chart.
When I find something interesting there are a series of charts that I review. Dr Alexander has a triple screen for viewing charts and Trading for a Living. You start with the longest time frame

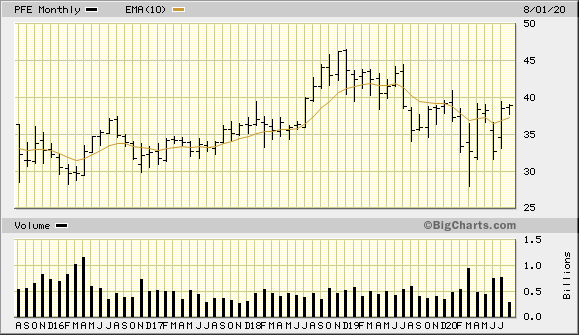
The longer term view I use is a 5 year monthly chart. I just have a 10 month Simple Moving Average (SMA) for a general trend. Above go Long. Below Short or pass on trade
The stock is currently 38.88 and have an upside target at 20% = 46.66 in new high territory. The stock is fighting a couple year downtrend
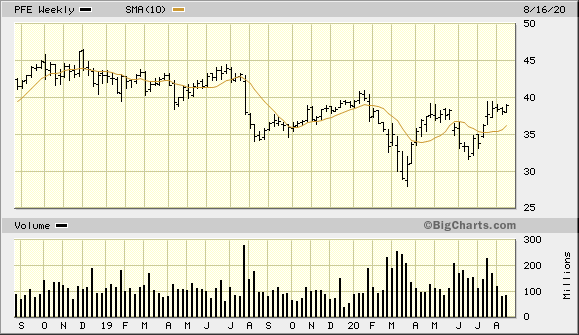
Then I review the 2 year weekly with a 50 week Simple Moving Average (SMA). This is roughly 1 year and here again I'm looking for the general trend. Above is good

52 Week Range:
40.97 - 27.88 = 13.09 / 40.97 = 31.9%
This is a shallow Cup at about -30% down and shows institutional support
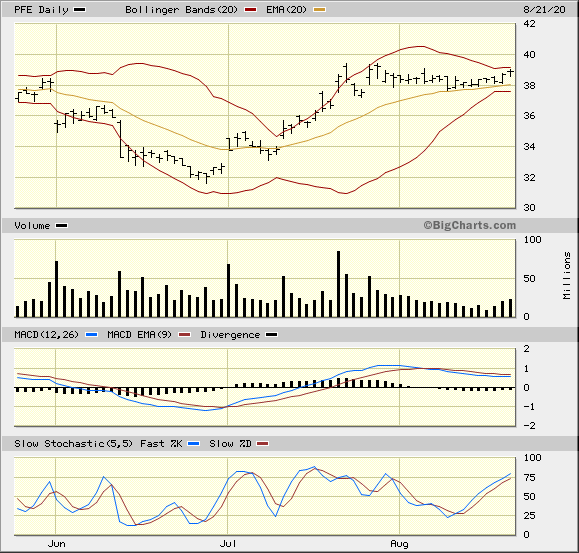
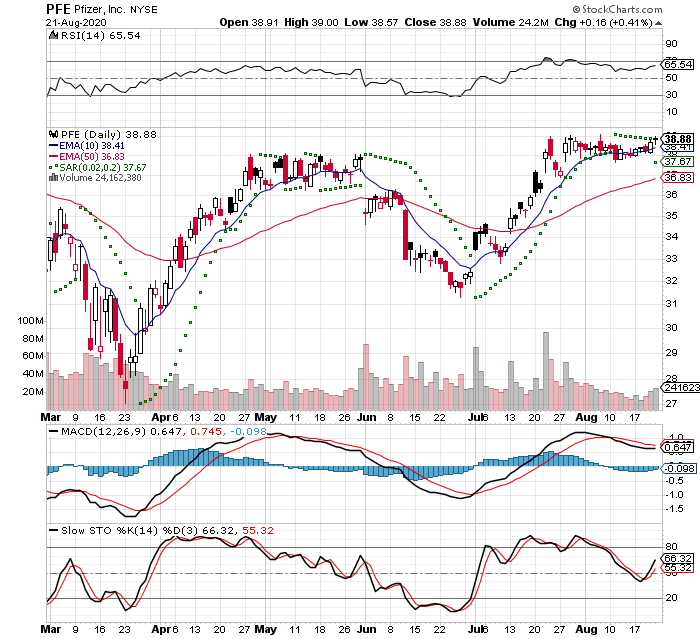
Then I drill into 2 different 3 month views: Bigcharts and StockCharts

The view is using Bollinger Bands from StockCharts. I like using a 20 day Exponential Moving Average to represent about 1 month of trading for the monthly trend. Moving Average Convergence Divergence MACD and Historgram
The idea of the trade plan is an option play past earnings. It's above the 20 Day EMA, Bollinger Bands are contracting, MACD is positive, but the Histogram is negative.
The stock will break out either up our down. I'm thinking that it will be on the upside, because the past few days have had increasing price with increasing volume. The Histogram is trending to the zero line

This view is using Relative Strength Indicator RSI which is mid range with a slight up tic, Parabolic Stop And Reverse PSAR that I use to gauge if the short term trend is either positive or negative. This indicator can have many whipsaws, but I just use it as a general indicator
There is a MACD with slightly different parameters than BigCharts. Slow Stochastic is at the bottom
I placed an order: Buy to Open 2 PFE Nov 20 2020 39.0 Call Limit 2.20
Stop Loss -8% at $35.77
Upside Target +20% at $46.66
This will hit some resistance around $45 as it approaches the previous
range. That would be about a 10% gain, but I suspect that it would go
higher because of the recent trading.
IBD Rankings 08/21/19
Composite Rating: 78
EPS Rating: 73 - Little low
RS Rating: 76 - Little low
Group RS Rating: C+
SMR Rating: B
Acc/Dis Rating: A-
ROE: 26.4%
Debt: 56%
Outstanding Shares: 5556.9m
Float: 5501.3
EPS Due Date: 10/29/20. My trade is taking advantage of this event
From TD Ameritrade Quote Summary 08/19/20
P/E Ratio: 15.82x
Ex-dividend date: 07/30/20
Zacks has PFE as Hold - 3. I like to have confirmation from Zacks to confirm IBD
So this is a short term trade that will last approximately one month unless
the market moves against the trade
Until next time,
Bryan