Note: This is a trade idea. Please do you own due diligence
This trade idea came to me by reviewing Investors Business Daily Stocks on the Move. There is no real market for options and would be a long stock trade
I see this as a 9 month Cup and Handle formation and the recent trading activity sparked my interest.
Then it hit a new high 5 days ago and is currently down. I find the current trading activity interesting.
When I find something interesting there are a series of charts that I review. Dr Alexander has a triple screen for viewing charts and Trading for a Living. You start with the longest time frame
The longer term view I use is a 5 year monthly chart. I just have a 10 month Simple Moving Average (SMA) for a general trend. Above go Long. Below Short or pass on trade
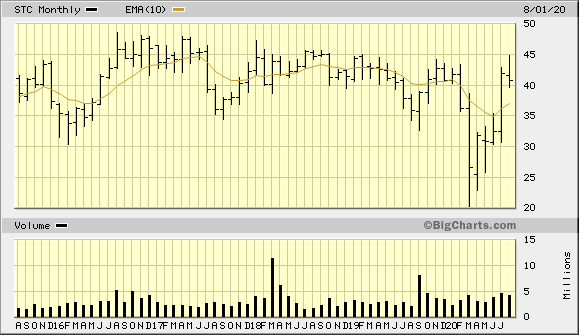
I am placing my upside target at 46.83 at the upper range of the long term high. This will hit resistance around $45.
Then I review the 2 year weekly with a 50 week Simple Moving Average (SMA). This is roughly 1 year and here again I'm looking for the general trend. Above is good
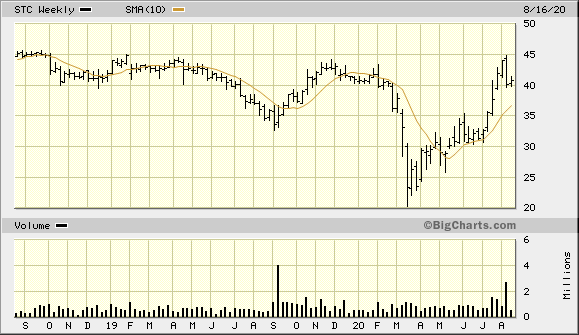
52 Week Range:
44.86 - 20.26 = 24.6 / 44.86 = 54.8%
This the deepest part of the Cup on the chart Apr 24 - Mar 20. However, most of the market has a similar chart
Normally we are looking for a Cup that is -40% deep
At -50% deep, a very different type of speculator evolves, because they see a decline of -50% and look to double their money and get out, instead of having a long time commitment
A Cup that is only -40% down means that there is institutional support at this level. They have the deep pockets for the research teams and will be buying when the stock dips to this level
Then I drill into 2 different 3 month views: Bigcharts and StockCharts
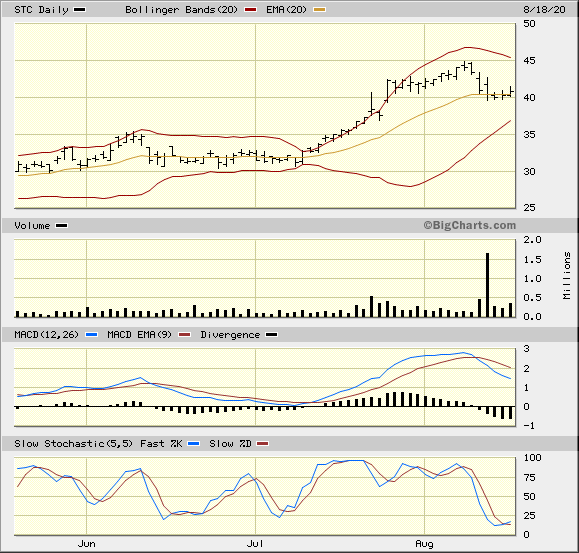
The idea of the trade plan is to take advantage of a temporary oversold situation. The view is using Bollinger Bands from StockCharts. I like using a 20 day Exponential Moving Average to represent about 1 month of trading for the monthly trend. Moving Average Convergence Divergence MACD and Historgram
Look at the heavy selling on 08/17, but it held at the 20 Day EMA. The stock seems to be weathering the selling an creating an oversold condition. Notice the last positive day on increasing volume
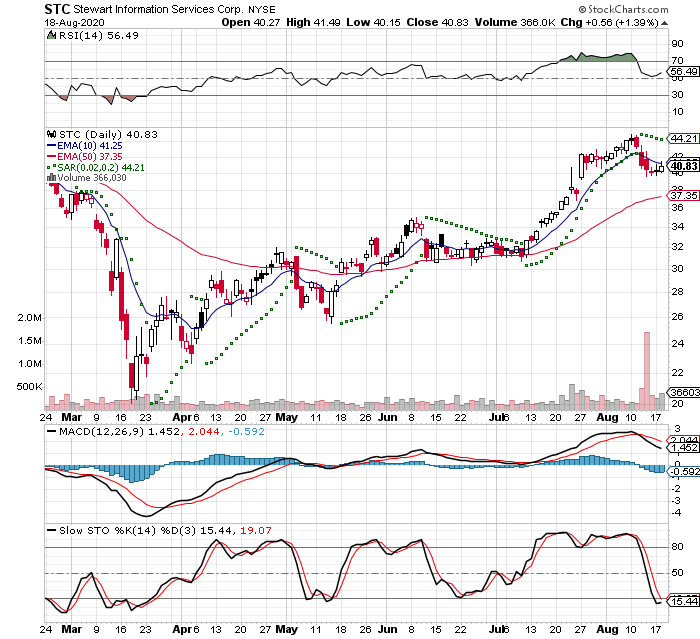
This view is using Relative Strength Indicator RSI which is midrange with a slight up tic, Parabolic Stop And Reverse PSAR that I use to gauge if the short term trend is either positive or negative. This indicator can have many whipsaws, but I just use it as a general indicator
There is a MACD with slightly different parameters than BigCharts. Slow Stochastic is at the bottom
I placed a Limit order for 100 shares at $40.83 - Previous Close. I got filled early in the morning
Cost: $40.83
Stop Loss -8% at $35.94
Looking at the chart I'm setting the stop at 36.11 which is the bottom shadow of the close before the recent gap up on 07/24
Upside Target +20% at $46.83
This will hit some resistance around $45 as it approaches the previous range. That would be about a 10% gain, but I suspect that it would go higher because of the recent trading.
IBD Rankings 08/19/20
Composite Rating: 86
EPS Rating: 93
RS Rating: 76
Group RS Rating: D+
SMR Rating: c
Acc/Dis Rating: B+
ROE: 9.3%
Debt: 14%
Outstanding Shares: 23.7m
Float: 23.0m - Thin
EPS Due Date: 10/22/20. I am not planing on staying for this event, but I could capture the dividend
From TD Ameritrade Quote Summary 08/19/19
P/E Ratio: 9.21
Ex-dividend date: 10/22/20
Zacks has a Strong Buy - 1. I like to have confirmation from Zacks to confirm IBD
So this is a short term trade that will last approximately one month unless the market moves against the trade
Until next time,
Bryan
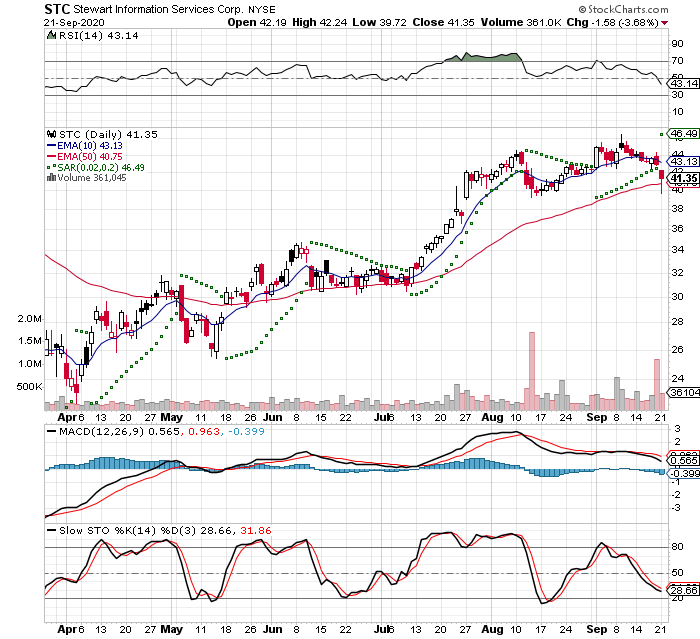
2020-09-21
I closed out of this position today, because I was up 10% and today it gaped down. I sold about noon ET. I got filled at 40.07 and had a loss of -76.10 or -1.86%
