Vici Properties Inc (VICI)
2018-10-15
This trade idea came from my review of the Investor’s Business Daily – IBD Weekly, VOL 35 N.O. 28 Week of October 15, 2018. This was ranked in IBD50 as #44
This company is a REIT and was considering on investing longer term money one of those. This morning I bought within the first hour of trading. I’m increasing my stop to -8%, because I’m not as concerned about the exact entry
I got filled at: $20.87
-8% stop: $19.20
+20% Target: $25.04
IBD Rankings today
Composite Rating: 97
EPS Rating: 98
RS Rating: 75
Group RS Rating: B-
SMR Rating: A
Acc/Dis Rating: C+
ROE: 1.8%
Debt: 102%
Outstanding Shares: 370.2m
EPS Due Date: 10/28/18
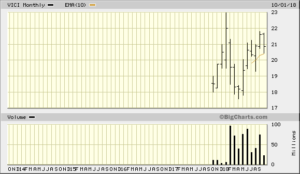
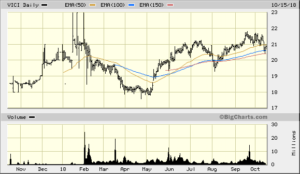
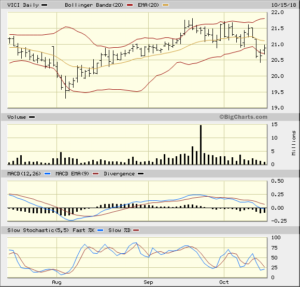
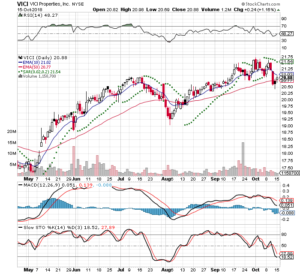
Dr Alexander has a triple screen for viewing charts and Trading for a Living is why I use the following charts
2018-10-18
This morning I bought an additional 100 shares, because I liked the way it was trading. There was a good day yesterday on strong volume – about 2.5x’s.
I got filled at: $21.60
-8% stop: $20.52
+20% Target: $25.92
This raised my cost basis, but it is going the direction I wanted it to go and I’m averaging up. Adding to a losing position can destroy an account. I admit I’m wrong and move on
My average position numbers are:
Cost: $21.34
-8% stop: $19.36
+20% Target: $25.48
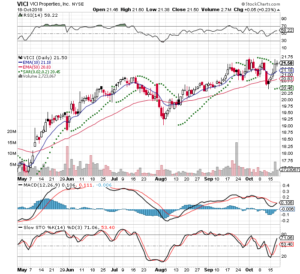
The MACD is still positive and the MACDH is about to cross the zero line
Here is the 3 month chart from Stockcharts
2018-12-11
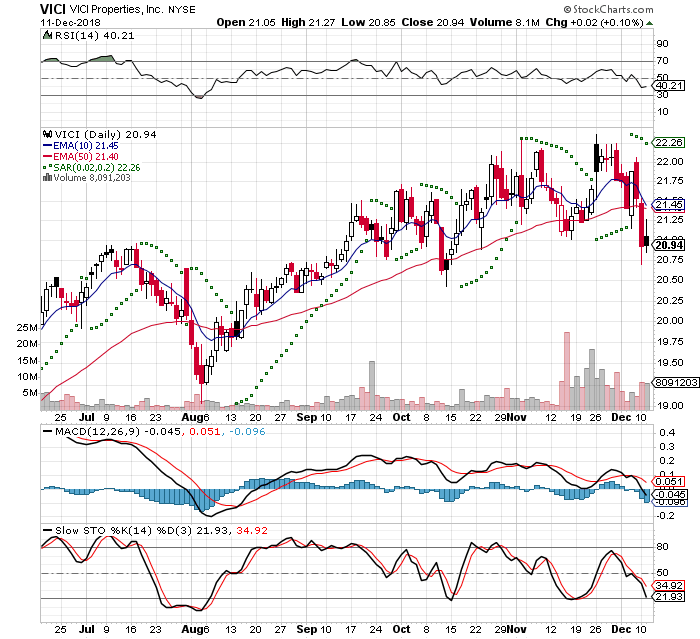
I closed out the position today $21.22 at a loss of -$.01, because it was not performing correctly. There was an article a couple of days ago about this being a possible short candidate for hedge funds.
Here is the current 3 Month Chart from Stockcharts.com
