Orion Engineered Carbns – OEC
2018-07-22
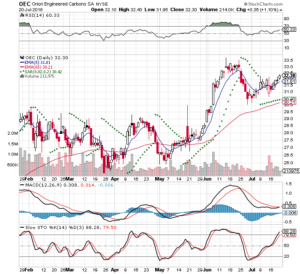
I had been watching this stock from last quarter and I think the time is right for a pop. I’m watching the MACD cross over. The current stock price is at $32.30
-5% stop loss: $30.89
+20% gain: $38.76
Here are the IBD Rankings on the Friday edition of IBD Weekly VOL. 35, No.16 Week of July 23, 2018
IBD Rankings today
Composite Rating: 96
EPS Rating: 88
RS Rating: 87
Group RS Rating: B
SMR Rating: A
Acc/Dis Rating: B
ROE: 126.2
Debt: 0%
Outstanding Shares: 59.3m
Dr Alexander has a triple screen for viewing charts and Trading for a Living is why I use the following charts
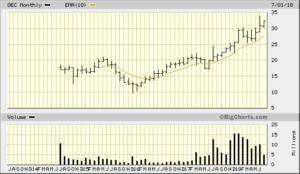
5 year monthly chart from bigcharts
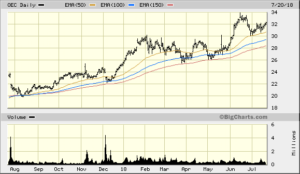
1 year daily chart from bigcharts. I use a 3 tier 50 day EMA. What I’m looking for is a cross over for the shorter term over the long term. The 50 EMA should be a level for institutional support
The 3 Month Daily has the MACD and histogram crossing the zero line|
3 Month Daily from StockCharts.com
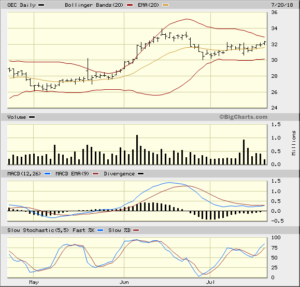
3 Month Daily from StockCharts.com
2018-07-23
My order got filled at $32.35 at the open. This slightly adjust my numbers:
-5% stop loss: $30.73
+20% gain: $38.82
2018-09-05
I closed this position to protect a profit. This was trading well and I was up approximately 10%, but things changed I had expected it to clear the resistance at $36. It didn’t…
I had checked this and realized that I should be further ahead then where it was trading. I knew something was wrong and I sold
Opened position at: $32.35
Closed position at: $33.05
+ $70 or +2.2%
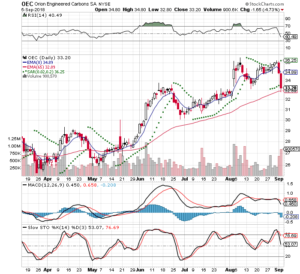
I will still be watching this company, but the timing is not right now. Here is the 3 month daily from Stockcharts.com
