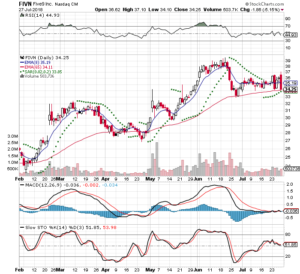
Five9 Inc – FIVN
2018-07-23I had been watching this stock for a while. I had bought and sold this for a short term gain. I did not have the time to share this with you, but this is how it went
FIVN 100 32.81 Buy 05/22/18
FIVN 100 37.97 Sell 06/18/18
I have kept this on my watch list and I placed an order to buy at the open. I know that my execution is not going to be great, but I think that the random entry would still be profitable
Friday’s closed at $35.18
-5% stop = $33.42
20% Target = $42.22
Here are the IBD Rankings on the Friday edition of IBD Weekly VOL. 35, No.16 Week of July 23, 2018
IBD Rankings today
Composite Rating: 96
EPS Rating: 77
RS Rating: 93
Group RS Rating: A+
SMR Rating: B
Acc/Dis Rating: D+
ROE: 16.2
Debt: 85%
Outstanding Shares: 57.7m
Dr Alexander has a triple screen for viewing charts and Trading for a Living is why I use the following charts
5 year monthly chart from bigcharts
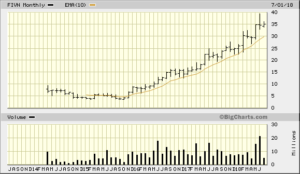
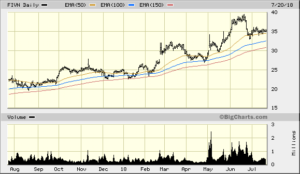
1 year daily chart from bigcharts. I use a 3 tier 50 day EMA. What I’m looking for is a cross over for the shorter term over the long term. The 50 EMA should be a level for institutional support
With the 3 month daily I’m looking for a MACD and the MACD Histogram crossing the zero line
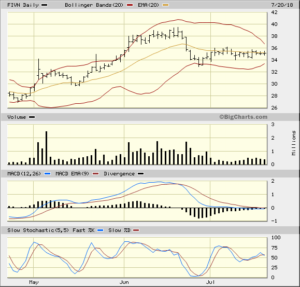
Now for StockCharts
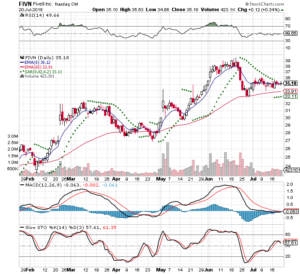
I’m looking for the MACD cross over pop. If I’m wrong cut your losses
2018-07-24
I got filled at the open at $35.39 and my adjusted numbers are:
-5% stop = $33.62
20% Target = $42.47
2018-07-27
I sold Friday and closed out my postition, because the stock dropped and feel that it will hit my stop. My order got filled at $34.33 and I had a loss of $106 not counting commissions
