B O F I Holding Inc – BOFI
2018-08-08
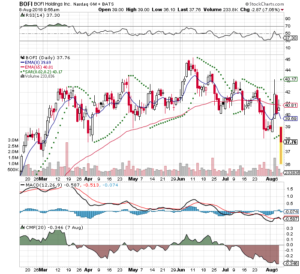
I held the position until they posted earnings and it wasn’t good. The position started to move against me early. I had watch the position deteriorate with the idea that a positive earnings announcement would rescue the trade. It didn’t happen…
This morning I placed a market order to Sell to Close after it gaped down. I had previously held it open and that was an error. For me, it’s better to close out a losing trade and move on instead of devoting more time to it.
The idea was to let it expire worthless instead of paying to close this out, but the reality I lost the money and my time was better served by moving on
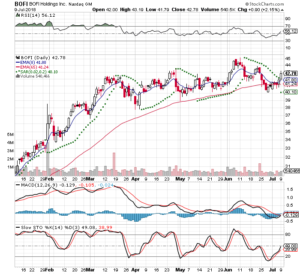
Here is the 3 month chart from Stockcharts
2018-07-10
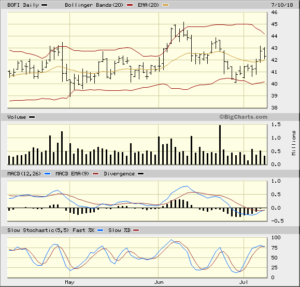
This has been on my watch list for quite some time and believe this is now an opportunity. PSAR flipped below and MACD about to cross zero. They will be posting earnings 07/28 and there are 38 days left in the Aug 17, 2018 call
I bought the OTM call $45.00. My order got filled at 1.25
Open Interest: 234
Implied Volatility: 35.85
Delta: .3242
The IBD Rankings
Composite Rating: 96
EPS Rating: 91
RS Rating: 91
Group RS Rating: B+
SMR Rating: A
Acc/Dis Rating: B-
ROE: 17.8%
Debt: 83%
Outstanding Shares: 62.6m
Next Earnings Announcement: 07/28/18
Dr Alexander has a triple screen for viewing charts and Trading for a Living is why I use the following charts
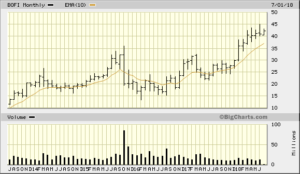
5 year monthly chart from bigcharts
1 year daily chart from bigcharts
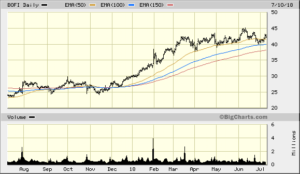
3 month daily chart from bigcharts
3 month daily from stockcharts
